Download
1 / 3
30 likes | 182 Views
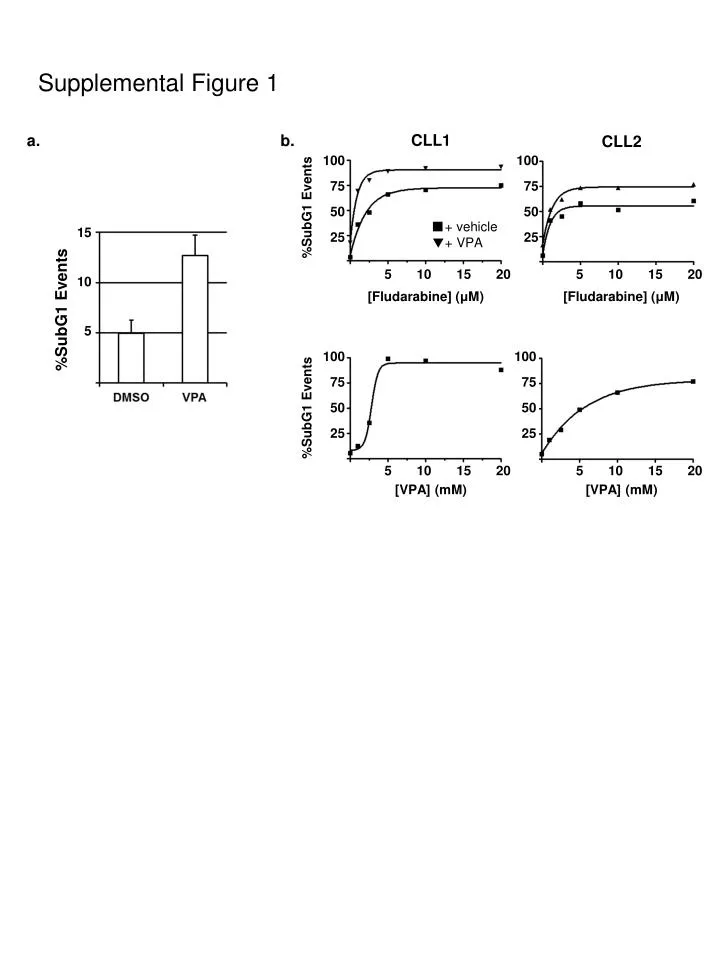
Supplemental Figure 1. CLL1. a. b. CLL2. %SubG1 Events. + vehicle + VPA. [ Fludarabine] ( μ M). [ Fludarabine] ( μ M). %SubG1 Events. %SubG1 Events. [VPA] (mM). [VPA] (mM). Supplemental Figure 2. a. b. Mean Fluorescent Intensity. Supplemental Figure 3. a. c. scrambled

E N D
Supplemental Figure 1 CLL1 a. b. CLL2 %SubG1 Events + vehicle + VPA [Fludarabine] (μM) [Fludarabine] (μM) %SubG1 Events %SubG1 Events [VPA] (mM) [VPA] (mM)
Supplemental Figure 2 a. b. Mean Fluorescent Intensity
Supplemental Figure 3 a. c. scrambled RelA siRNA %SubG1 Events I-κB Actin BJAB cells b. d. Control SN50 IKK-NBD %SubG1 Events RelA Actin