Download
1 / 7
80 likes | 223 Views
Weather Forecasting. Eportfolio assignment 2 met 1010-044 Jayelle Hegewald. The forecast. I gathered the first map on Sunday evening, September 30 at 2300, with an effective time of 1200 on Tuesday, October 2 at KSDF, the airport code for Louisville, KY. The result. The result.

E N D
Weather Forecasting Eportfolio assignment 2 met 1010-044 Jayelle Hegewald
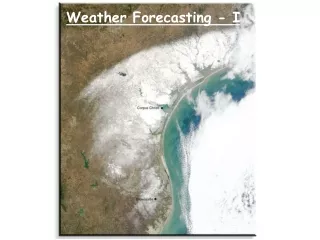
The forecast • I gathered the first map on Sunday evening, September 30 at 2300, with an effective time of 1200 on Tuesday, October 2 at KSDF, the airport code for Louisville, KY.
The result • When I checked back in 48 hours, it appeared that there were no significant weather disturbances during the time frame forecasted on the map (Tuesday 1200) that I collected on Sunday evening.
The result • The available Doppler and infrared data that I found were past the effective time of noon, and were into the next day, universal time. However, according to the data I collected, there was observable weather and precipitation, but it happened about 15-17 hours after the forecasted weather. The Doppler and Infrared data show that a small amount of measurable precipitation was actually calculated at about 5 AM on October 3, while the 48 hour forecast had forecasted the precipitation for noon the previous day.
Forecasting tools Doppler radar infrared
reflection • Reflection: • As a result of completing this assignment, I have learned how to read a few of the tools that meteorologists use on a daily basis. Watching the news reports on TV has a whole new meaning now, and it is a little easier to give the meteorologists a break when they are wrong. It is a hard job to be able to determine when and where weather will hit based on the information that is available. There are many factors which can influence the outcome of a weather system, and from this exercise, I feel that I understand those factors more fully.