Download

1 / 39
390 likes | 564 Views
On the diagnosis of deep convection. Richard (Rick)Jones Regional Training Workshop on Severe Weather Forecasting Macau, April 8 -13 , 2013. Overview . Overview of the key ingredients of deep convection Key stability indices and precipitable water (PW) or total column water TCW

E N D
On the diagnosis of deep convection Richard (Rick)Jones Regional Training Workshop on Severe Weather Forecasting Macau, April 8 -13 , 2013
Overview • Overview of the key ingredients of deep convection • Key stability indices and precipitable water (PW) or total column water TCW • PW is the prime driver of convection • Forecast deep convection and limits of predictability
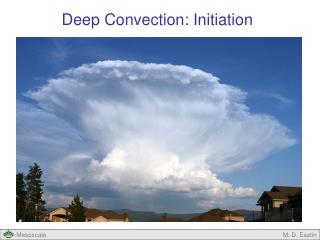
Basic Ingredients • Source of moisture best described by precipitable water (PW) • Sustained PW plumes are often associated with prolonged and record/near record events • related to convectively available potential energy • Method to lift the air • Topography – upslope • Density boundaries fronts; sea-breeze fronts • Instability -> maximize lift & sustain development
Classic Stability forecast Indices & Methods • The K-index • The Totals Totals Index • The Lifted Index • Showalter Stability index (more mid-latitude) • CAPE & CIN
The K-Index Based on 850 to 500 hPa lapse rate to identify convective and heavy-rain producing environments as it accounts for moisture. With contribution of 850 hPa dew point and 700 hPadewpoint depression KI = (T850-T500)+Td850-(T700-Td700) KI = (T850-T500)+Td850-(DD700)
KI normally above ~28-38 • KI good for potential areas of convection • Related to heavier rainfall when have lift and moisture • Limitations when terrain above 850 hPa • Good in models and in soundings
Using the K-index • Heavy rainfall combination of instability and deep moisture • Favors values of K-index upper 20s to mid 30s. • Still need deep moisture and lift to get convective response • Sample values tropical heavy (Laing 2004)
Totals Totals Index (TTI) • Stability relative to 850 hPa and 500 hPa • 2 components: • Cross Totals: CT = Td850 – T500 • Vertical Totals: VT = T850 - T500 TTI = (T850 + T850 ) – 2T500 • Focus on instability between 850 and 500 hPa with a component of moisture at 850 hPa
Lifted Index (LI) • Lifted index is based on a parcel reaching the Lifting condensation level (LCL) then adiabatically lifting it to 500 hPa. • It is often surface or moist boundary layer based • Accounts instability based on difference LI = Tlift- T500
LI • Areas Low LI often have convection • LI < 0 is a good starting point • LI often related to CAPE and as we will see CAPE often relates to Precipitable water
Showalter Stability Index (SSI) • SSI similar to Lifted index but based an 850 hPa parcel reaching the Lifting condensation level (LCL) then adiabatically lifting it to 500 hPa. • It is often surface or moist boundary layer based • Accounts instability based on difference SI = T500-Tlift
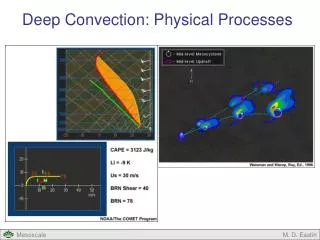
The Power of Convective Available Potential Energy (CAPE) • On energy diagram • Tephi or Skew-T area proportional to energy • Integrated value and like SSI & LI a theoretical parcel is lifted adiabatically from the LCL until the equilibrium level is reached. • CAPE: convective available potential energy • Release of energy produces deep updrafts • Greater the area stronger the updraft • Can have fat or skinny CAPE
CIN: convective inhibition • Another equal area value based on Tephi- or Skew-T diagram • CIN is negative and represents stability and the lift must be able to over to overcome it unless it is diminished
LFC and LCL • See LFC2
CAPE and updrafts • CAPE may also be related to updraft velocity via the relation Wmax = sqrt(2*CAPE) • For example a CAPE of 2500 J/kg, the maximum updraft velocity would be about 71 m/s!! • In reality, water loading, entrainment, and other factors can reduce Wmax by as much as a factor of 2.
Direct Link CAPE & LINE US based study CAPE ~1200JKg-1 with LI <0
Other Parameters Associated with heavy rainfall and convection • Precipitable water (PW) • Main driver of convection related to rainfall and convection • Equivalent potential temperature • Vertical Velocity • Estimated from CAPE for updraft speed • Areas of ascent in Numerical guidance which could favor releasing instability
Precipitable water is the main driver • Need to know • when PW is abnormally high • High PW source regions • PW often a proxy for CAPE • High CAPE is often co-located with high PW values • Heavy rainfall almost always associated with PW plumes
Equivalent Potential temperature • Also known as pseudo-equivalent potential temperature is attained by parcel is lifted to the LCL and taken up a pseudo-adiabat (moist) to the level where air dries out and then dry adiabatically to 1000 hPa (the reference pressure). • Normally qe increases with height. • Convection it decreases with height • Can use qe • In vertical for stability • Horizontal for boundaries which could trigger convection
NCEP qe • Produced in Plan view • 925, 850, 700, 500, 300 and 200 hPa • Should show boundaries • Low over high values could favor convection • CAPE easier to find convective instability
Limitations • Indices are computed with fixed levels • 850 hPa surface may be under ground • This impacts KI,TTI and need to modify to a level above terrain • Indices • Will vary from grid point to point • Model resolution will impact • The details • And what we can predict next slide
Limits of Predictability: Error Growthhigher resolution models will resolve features EFS may filter out • Finer scale features • Fast growing error modes • Fine scale features have rapid error doubling rates Errors doubling time in days! Mesoscale error growth is fast!
Salient Points • EFS and global models • are too course for features which can really impact the local and regional weather • Smooth out terrain features • Smooth out finer scale features • Flooding and severe weather events are typically meso scale features • Finer resolution models and Local Area Models, short range EFS play a valuable role in filling the gaps • Diagnosis of stability can help in many cases
Review/summary • Overview of the key ingredients of deep convection • Key stability indices and precipitable water (PW) • PW main driver • Forecast deep convection and limits of predictability
References Convective Indices • Laing, Arlene G. (2004) Cases of Heavy Precipitation and Flash Floods in the Caribbean during El Niño Winters. Journal of Hydrometeorology. Volume 5, Issue 4 (August 2004) pp. 577-594 • N Ravi, U C Mohanty, O P Madan, R K Paliwal. (1999) Forecasting of thunderstorms in the pre-monsoon season at Delhi. Meteorological Applications6:1, 29-38 • UCAR Comet:https://www.meted.ucar.edu/index.php