Download
1 / 24
240 likes | 387 Views
Neural Network Forecasting with the S&P 500 Index Across Decades. M.E. Malliaris & A.G. Malliaris. July 23, 2013 The 9 th International Conference on Data Mining, Las Vegas. QUESTIONS. Are there stable patterns of directional movement in the S&P 500?

E N D
Neural Network Forecasting with the S&P 500 Index Across Decades M.E. Malliaris & A.G. Malliaris July 23, 2013 The 9thInternational Conference on Data Mining, Las Vegas
QUESTIONS • Are there stable patterns of directional movement in the S&P 500? • If so, can we use those patterns to forecast? • Do these patterns and their importance change over time?
DATA SET • Closing values of the S&P 500 from 1950 through 2010 [6 decades] • Derived variables: • % change in closing • Moving averages • Patterns of Up and Down movement • Number of Ups
DATA SET DIVISIONS • Divided by Decade for analysis and training • 10 Years used for training, • e.g., 1950 - 1959 • The Year immediately following a Decade was used as a validation set • e.g., 1960
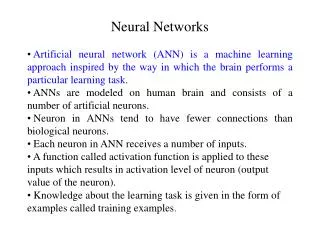
METHODOLOGY • Neural Network • Structure: Identical for all networks • 14 Inputs • One Hidden Layer with 9 nodes • 1 Output [tomorrow’s direction] • Random Seed: 229176228 • 30% used to prevent over-fitting
Summary • Neural Networks with the same structure were trained for six decades • This identicalstructure,usingthe same inputs, wasuseful for over six decades. • All variables were generated from the S&P 500 closing price • Variable importance shifted slightly over time • Successfulforecastingwas possible
Future Research • Future researchmightinvestigate a smaller training time, say a rollingwindow of one or twoyears. • This mightenable us to see the importance of specific variables graduallyshifting over time.