Download
1 / 29
330 likes | 425 Views
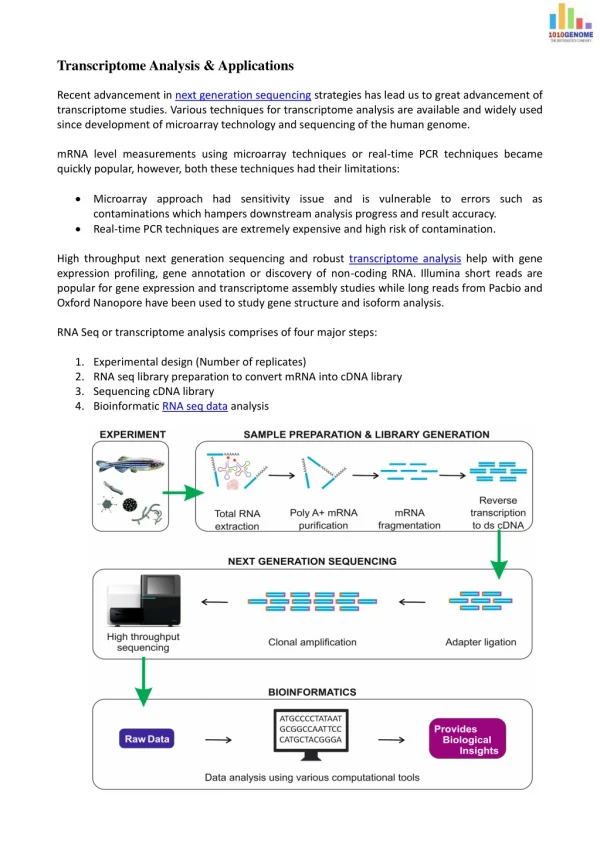
Transcriptome Analysis. Technology and Analysis overview. Roy Williams PhD; Burnham Institute for Medical Research. Measuring Gene Expression.

E N D
Transcriptome Analysis Technology and Analysis overview Roy Williams PhD; Burnham Institute for Medical Research
Measuring Gene Expression Idea: measure the amount ofmRNAto see whichgenesare beingexpressedin (used by) the cell. Measuringproteinwould be more direct, but is currently harder.
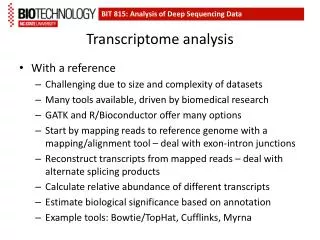
General assumption of microarray technology • Use mRNA transcript abundance level as a measure of expression for the corresponding gene • Proportional to degree of gene expression
How to measure RNA abundance • Several different approaches with similar themes • Illumina bead array – highly redundant oligo array • Affymetrix GeneChip – highly redundant oligo array • Nimblegen – highly redundant oligo array • 2-colour array (very long cDNA; low redundancy) • SAGE (random sequencing of cDNA library)
The Illumina Beadarray Technology • Highly redundant ~50 copies of a bead • 60mer oligos • Absolute expression • Each array is deconvoluted using a colour coding tag system • Human, Mouse, Rat, Custom
Figure 1. Design of a randomly assembled gene-specific probe array x,y array coordinate Kenneth Kuhn et al. Genome Res. 2004; 14: 2347-2356
Affymetrix Technology • Highly redundant (~25 short oligos per gene) • Absolute expression • PM-MM oligo system valuable for cross hybe detection • Human, Mouse, E. coli, Yeast…….. • Affy and illumina arrays have been systematically compared
Spotted Arrays • Low redundancy • cDNA and oligo • Two dyes Cy5/Cy3 • Relative expression • Cost and custom
Corporate Cartoons • Measuring Gene Expression • http://www.affymetrix.com/corporate/outreach/lesson_plan/downloads/function.swf
Microarrays in action off on
Areas Being Studied with Microarrays • Differential gene expression between two (or more) sample types • Similar gene expression across treatments • Tumor sub-class identification using gene expression profiles • Classification of malignancies into known classes • Identification of “marker” genes that characterize different cell types • Identification of genes associated with clinical outcomes (e.g. survival)
Microarray experiments mRNA levels compared in many different contexts • Different tissues, same organism (brain vs liver) • See GNF Tissue Atlas • Same tissue, same organism (treated vs control, tumor vs non-tumor, undiff vs diff) • Same tissue, different organisms (wt v. ko) • Time course experiments (effect of ttt, development)
ChIP-on-chip hybridization Snap shot of transcription factors bound to locations in the Genome
Genome-wide data sets: considerations and complications Factors to consider when analysing genome-wide data sets • How were the data generated? • What method was used? Are there any technical limitations? • On how many repeats is the data set based? How reproducible are the data? • Has the error rate been estimated? If so, how high is it? • Can known and trusted examples be confirmed? • How complete is the data set? Which genes or proteins are missing? • How was the data analysed? • Do genes or proteins of interest also appear in other data sets? • Complications when comparing genome-wide data sets • Different isolates and experimental conditions have been used • Databases are not interconnected • There is no unifying data format (.GCT format is close…..) • Keywords for database searches are not standardized • Some data are not readily accessible or in the public domain
Microarrays and Stem Cells • Isolate and analyse as many different types of stem cells (and others) as possible • Discover structure/patterns in data • Classify/cluster genes according to their expression profile • Determine transcription circuitry
Aim: • Group together (cluster) genes that behave similarly across different conditions • Define/quantify similarities • There are dozens of similarity metrics • Euclidean distance • Pearson correlation • Standard correlation
Hierarchical Gene Clustering Genes 153 stem cell Samples
Cell Cycle Gene Cluster Guilt by Association!
K-means and NMF clustering • Classifies genes into non-overlapping groups • The number of clusters is specified by the user (k) • Unsupervised methods
K-means Clustering • INPUT
K-means Clustering • OUPUT: sorted into 16 groups
NMF clustering: current favourite Output is a correlation matrix Can see relationships between clusters Gives QC for output USED FOR: Cancer Classification Stem Cell Classification NMF is the most accurate classification technique: proven! Nested groups
Which types of genes are enriched in a cluster? Our Cell cycle • Idea: Compare your cluster of genes with lists of genes with common properties (function, expression, location). • Find how many genes overlap between your cluster and a gene list. • Calculate the probability of obtaining the overlap by chance This measures if the enrichment is significant. • This analysis provides an unbiased way of detecting connections between expression and function. 0 15000 25 7 GeneOntology Cell cycle
Demo of Ingenuity Pathway Analysis • Detects networks in your data • Allows you to look for connections between genes and drugs/small molecules • User friendly