Download
1 / 10
110 likes | 347 Views
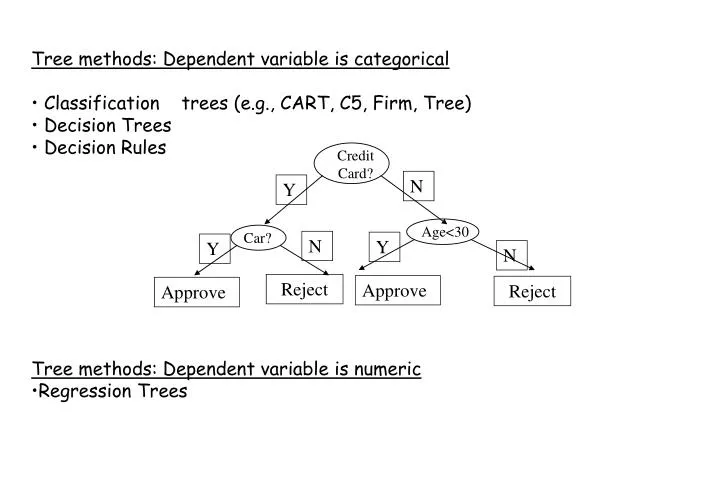
Credit Card?. Car?. Age<30. N. Y. N. Y. Y. N. Reject. Approve. Reject. Approve. Tree methods: Dependent variable is categorical Classification trees (e.g., CART, C5, Firm, Tree) Decision Trees Decision Rules Tree methods: Dependent variable is numeric Regression Trees. Y.

E N D
Credit Card? Car? Age<30 N Y N Y Y N Reject Approve Reject Approve • Tree methods: Dependent variable is categorical • Classification trees (e.g., CART, C5, Firm, Tree) • Decision Trees • Decision Rules • Tree methods: Dependent variable is numeric • Regression Trees
Y Y<4 Y<2 X<3 Tree form of f(X,Y) Function f(X,Y) 0 0 4 1 2 2 2 2 3 X 2 1 Classification trees
Classification tree for the cancer groups using 10 principal components of the top 100 cancer genes. The classification rule produces zero mistakes in the training set and five mistakes in the testing set.
Credit Card? Car? Age<30 N Y N Y Y N Reject Approve Reject Approve • Tree methods: Dependent variable is categorical • Classification trees (e.g., CART, C5, Firm, Tree) • Decision Trees • Decision Rules • Tree methods: Dependent variable is numeric • Regression Trees
Y Y<4 X<3 Y<2 0 0 4 3 2 2 2 5 3 X 5 3 Trees Function f(X,Y) Tree form of f(X,Y) • Classification & Regression Trees • Fit a tree model to data. • Recursive Partitioning Algorithm. • At each node we perform a split: we chose a variable X and a value t that minimizes a criteria. • The split: L = {X < t} ; R = { X t}
Regression Tree for log(Sales) HIP95 < 40.5 [Ave: 1.074, Effect: -0.76 ] HIP96 < 16.5 [Ave: 0.775, Effect: -0.298 ] RBEDS < 59 [Ave: 0.659, Effect: -0.117 ] HIP95 < 0.5 [Ave: 1.09, Effect: +0.431 ] -> 1.09 HIP95 >= 0.5 [Ave: 0.551, Effect: -0.108 ] KNEE96 < 3.5 [Ave: 0.375, Effect: -0.175 ] -> 0.375 KNEE96 >= 3.5 [Ave: 0.99, Effect: +0.439 ] -> 0.99 RBEDS >= 59 [Ave: 1.948, Effect: +1.173 ] -> 1.948 HIP96 >= 16.5 [Ave: 1.569, Effect: +0.495 ] FEMUR96 < 27.5 [Ave: 1.201, Effect: -0.368 ] -> 1.201 FEMUR96 >= 27.5 [Ave: 1.784, Effect: +0.215 ] -> 1.784 HIP95 >= 40.5 [Ave: 2.969, Effect: +1.136 ] KNEE95 < 77.5 [Ave: 2.493, Effect: -0.475 ] BEDS < 217.5 [Ave: 2.128, Effect: -0.365 ] -> 2.128 BEDS >= 217.5 [Ave: 2.841, Effect: +0.348 ] OUTV < 53937.5 [Ave: 3.108, Effect: +0.267 ] -> 3.108 OUTV >= 53937.5 [Ave: 2.438, Effect: -0.404 ] -> 2.438 KNEE95 >= 77.5 [Ave: 3.625, Effect: +0.656 ] SIR < 9451 [Ave: 3.213, Effect: -0.412 ] -> 3.213 SIR >= 9451 [Ave: 3.979, Effect: +0.354 ] -> 3.979
For regression trees two criteria functions are: • For classification trees: criteria functions
Regression Tree
Other methods: • Smart and Mars (see doc) • Regularized Discriminant Analysis • Bayesian Discriminant Analysis • Flexible Discriminant Analysis.
Classification tree: > data(tissue) > x <- f.pca(f.toarray(tissue))$scores[,1:4] > x= data.frame(x,gr=gr) > library(rpart) > tr =rpart(factor(gr)~., data=x) n= 41 node), split, n, loss, yval, (yprob) * denotes terminal node 1) root 41 22 3 (0.26829268 0.26829268 0.46341463) 2) PC3< -0.9359889 23 12 1 (0.47826087 0.47826087 0.04347826) 4) PC2< -1.154355 12 1 1 (0.91666667 0.00000000 0.08333333) * 5) PC2>=-1.154355 11 0 2 (0.00000000 1.00000000 0.00000000) * 3) PC3>=-0.9359889 18 0 3 (0.00000000 0.00000000 1.00000000) * > plot(tr) > text(tr) >