Download
1 / 60
610 likes | 902 Views
BIOL102 . BIOL102 . Classification and Phylogeny. Part 1 – A few reminders from lecture 3 • Species and Species Concepts • Prezygotic and Postzygotic Barriers • Allopatric and Sympatric Speciation • Rates of Speciation • Dynamics of Speciation.

E N D
BIOL102 Classification and Phylogeny Part 1 – A few reminders from lecture 3 • Species and Species Concepts • Prezygotic and Postzygotic Barriers • Allopatric and Sympatric Speciation • Rates of Speciation • Dynamics of Speciation Source of cover picture: Campbell et al. (2007) Essential Biology with Physiology, 2nd edition, Pearson Benjamin Cummings (San Francisco, CA), Figure 14.26
BIOL102 Classification and Phylogeny Part 2 – Classification • Scientific Fields • Linnaeus’ Taxonomic Systems • Binomial System of Nomenclature • The Linnaean Hierarchy • The Modern Taxonomic System • Species Definition
BIOL102 Classification and Phylogeny Part 3 – Phylogeny • The Concept of Phylogenetic Trees • Phylogenetic Datasets • Constructing Phylogenetic Trees • Logic Evaluation
• is defined as an evolutionarily independent population or group of populations • Biologists commonly use the following four approaches to identify species: the biological species concept the morphological species concept the ecological species concept the phylogenetic species concept Part 1 – A few reminders from lecture 3 Species and Species Concepts
• Biologists categorize the mechanisms that stop gene flow between populations into prezygotic barriers (before fertilization) and postzygotic barriers (after fertilization) prezygotic barriers: individuals of different species are prevented from mating postzygotic barriers: individuals from different populations do mate, but the hybrid offspring produced have low fitness and do not survive or produce offspring Part 1 – A few reminders from lecture 3 Prezygotic and Postzygotic Barriers
Part 1 – A few reminders from lecture 3 Allopatric and Sympatric Speciation • Allopatric speciationoccurs when geographic isolation creates a reproductive barrier (extrinsic mechanisms) • Sympatric speciationoccurs when a reproductive barrier is created by something other than geographic isolation (intrinsic mechanisms)
• differ among organisms and can occur in time scales a slow rate of speciation evidenced by a living horseshoe crab (13 species) and a 300 million year-old fossil a rapid rate of speciation evidenced by Galapagos finches which have diversified into 13 species within the last 100,000 years Part 1 – A few reminders from lecture 3 Rates of Speciation
Part 1 – A few reminders from lecture 3 Dynamics of Speciation • Gradual model traditional evolutionary trees diagram the descent of species as gradual divergence • Punctuated equilibrium model is a contrasting model of evolution states that species most often diverge in spurts of relatively sudden change accounts for the relative rarity of transitional fossils and hence appears to be a more accurate view of speciation dynamics
Part 2 – Classification A. Scientific Fields • Taxonomy science of classifying organisms groups all organisms hierarchically (such as domain, kingdom, phylum, class, order, family, genus, species) provides universal names for organisms and at least one reference to identify them (binominal nomenclature) • Phylogeny or Systematics study of the evolutionary history of organisms, their diversity and relationships
Part 2 – Classification B. Linnaeus’ Taxonomic Systems • In the 18th century, Carolus Linnaeus published a system of taxonomy based on resemblances • Two key features of his system remain useful today: two-part names for species (binomial nomenclature) hierarchical classification of organisms (Linnaean hierarchy)
Part 2 – Classification C. Binomial System of Nomenclature • Each species is assigned a two-part name or binomial, consisting of the genus and the species genus: capitalized and italics (Homo) specific epithet (unique for each species within the genus): lower case and italics (sapiens) assignments are “latinized” and consistently used worldwide (traditional and conventional aspect) both parts together name the species (for the example used: Homo sapiens)
• Linnaeus introduced a system for grouping species in increasingly broad categories organisms are organized in levels (taxonomic groups) from broad to narrow into kingdom, phylum, class, order, family, genus, and species species is the most narrow level, which is grouped to form a genus andsoon the broader taxa are not comparable between lineages (an order of snails has less genetic diversity than an order of mammals) Part 2 – Classification D. The Linnaean Hierarchy
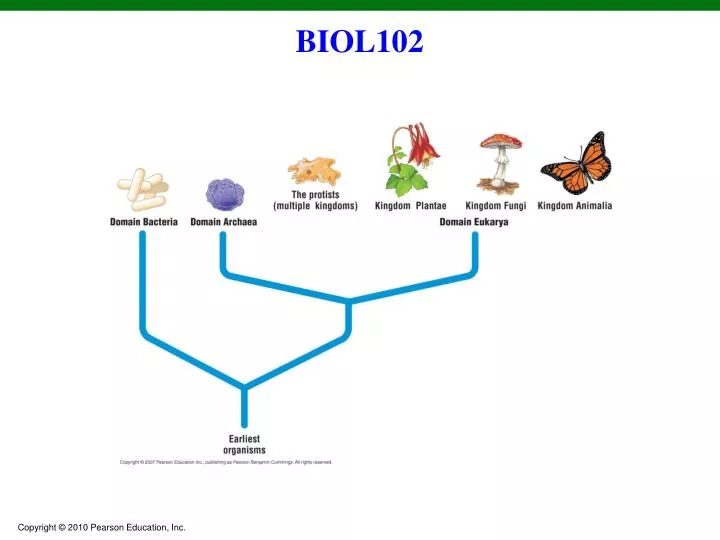
• Linnaeus designed a classification system with two kingdoms (plantae and animalia) the modern taxonomic system includes six kingdoms (bacteria, archaea, protista, plantae, fungi, and animalia) • Molecular studies led to the development of a three-domain system includes domains bacteria, archaea and eukarya categorizes the kingdoms protista, plantae, fungi, andanimalia into the domain eukarya Part 2 – Classification E. The Modern Taxonomic System
The Modern Taxonomic System Three-Domain System
The Modern Taxonomic System Domains and Kingdoms
Modified Levels of the Linnaean Hierarchy Species: Panthera pardus Genus: Panthera Family: Felidae Order: Carnivora Class: Mammalia Phylum: Chordata Kingdom: Animalia Domain: Bacteria Domain: Archaea Domain: Eukarya
Part 2 – Classification F. Species Definition • Species is generally defined as an evolutionarily independent population or group of populations • According to the biological species concept, species can be defined as a population or group of populations whose members have the potential to interbreed and produce fertile offspring members of this type of population must be eukaryotic and be able to sexually reproduce
Species Definition • Prokaryotic species + Eukaryotes that reproduce asexually: Collection of strains sharing a high degree of similarity in several independent traits (include 70% or greater DNA-DNA hybridization and 97% or greater 16S rRNA gene sequence identity) clone: population of cells derived from a single cell strain: genetically different cells within a clone •Viral species: population of viruses with similar characteristics that occupies a particular ecological niche
Part 3 – Phylogeny • Phylogeny as the evolutionary history of relationships among organisms or their genes is linked to classification, but can differ from them • Grouping organisms according to common properties implies that these groups evolved from a common ancestor and retain some of its characteristics, which can be revealed by shared derived features fossil record DNA and protein analyses
Part 3 – Phylogeny A. The Concept of Phylogenetic Trees • Phylogeny is portrayed in a diagram called a phylogenetic tree, which represents a hypothesis about evolutionary relationships each branch point or node of such a tree represents the divergence of two species
The Concept of Phylogenetic Trees • A rooted tree includes a branch to represent the last common ancestor of all taxa in the tree • A basal taxondiverges early in the history of a group and originates near the common ancestor of the group • Sister taxaare groups that share an immediate common ancestor • A polytomy is a branch from which more than two groups emerge
The Concept of Phylogenetic Trees Branch point or node: where lineages diverge Taxon A Taxon B Sister taxa Taxon C Taxon D Taxon E ANCESTRAL LINEAGE Taxon F Basal taxon Taxon G This branch point forms a polytomy: an unresolved pattern of divergence This branch point represents the common ancestor of taxaA–G
The Concept of Phylogenetic Trees • The timing of divergences is shown by the position of nodes on a time or divergence axis
The Concept of Phylogenetic Trees • Lineages can be rotated around nodes; the vertical order of taxa is largely arbitrary
The Concept of Phylogenetic Trees Taxa and Clades • A taxon (plural, taxa) is any group of species that we designate or name (e.g., vertebrates) • A taxon that consists of all the descendents of a common ancestor is called a clade or lineage
Order Family Genus Species The Concept of Phylogenetic Trees Panthera pardus (leopard) Connection between Phylogeny and Classification Felidae Panthera Taxidea taxus (American badger) Taxidea Carnivora Mustelidae Lutra lutra (European otter) Lutra Canis latrans (coyote) Canidae Canis Canis lupus (gray wolf)
Part 3 – Phylogeny B. Phylogenetic Datasets • To infer phylogenies, systematists analyze structural, developmental, genetic and other features of living species or, if needed and available, the fossil record of species that lived in the past based on homology • The cladistic approach to inferring trees focuses on synapomorphies, the (homology-based) shared derived characters of the species under study
Phylogenetic Datasets Synapomorphies • allow biologists to recognize monophyletic groups (clades or lineages) • are shared characteristics because their common ancestor had them • When many such traits have been measured, traits unique to each clade are identified and the groups are placed on a tree in the appropriate relationship to one another ancestral trait: characteristic that existed in an ancestor derived trait: a modified form of the ancestral trait, found in a descendant
Synapomorphies Ancestral and Derived Traits • Traits may be ancestral or derived, depending on the point of reference feathers are considered an ancestral trait for any particular group of modern birds however, in a phylogeny of all living vertebrates, feathers would be a derived trait found only among birds (a synapomorphy of the birds)
Phylogenetic Datasets Homology and Fossil Record • Homology is similarity resulting from common ancestry can be recognized and studied at three interacting levels: genetic, developmental, and structural • Fossils are traces of organisms that lived in the past make up the fossil record, which provides evidence of the extinction of species, the origin of new groups, and changes within groups over time
Homology Genetic Evidence
Homology Developmental Evidence
Homology Structural Evidence
Phylogenetic Datasets Distinguishing Homology from Homoplasy • Problems can arise with cladistic analyses because similar traits can evolve independently in two distant species rather than from a trait present in a common ancestor • Homology occurs when traits are similar due to shared ancestry • Homoplasy or analogy occurs when traits are similar due to convergent evolution
Distinguishing Homology from Homoplasy Convergent Evolution • occurs when similar environmental pressures and natural selection produce similar (analogous) adaptations in organisms from different evolutionary lineages example 1: ichthyosaurs (extinct aquatic reptiles) and dolphins (extant mammals) are very similar, but these similarities are not due to common ancestry example 2: bat and bird wings are homologous as forelimbs, but analogous as functional wings
Convergent Evolution • homology can be distinguished from analogy or homoplasy by comparing fossil evidence and the degree of complexity • Moreover, if similar traits found in distantly related lineages are indeed similar due to common ancestry, then similar traits should be found in many intervening lineages on the tree of life because all of the species in question inherited the trait from the same common ancestor
Fossils Fossilization • is the process of fossil formation, which preserves traces of organisms that lived in the past usually begins when part or all of an organism is buried in ash, sand, mud, or some other type of sediment
Fossils Types • There are four main types of fossils: intact fossils form when decomposition does not occur compression fossils form when sediments accumulate on top of the material and compress it into a thin film cast fossils form when the remains decompose after burial and dissolved minerals create a cast in the remaining hole permineralized fossils form when the remains rot extremely slowly and dissolved minerals infiltrate the interior of the cells and harden into stone
Types of Fossils • Fossilization only occurs under ideal conditions there are 10 specimens of the first bird to appear in the fossil record, Archaeopteryx as far as researchers currently know, only 1 out of every 200,000,000 individuals fossilized
Fossils Limitations of the Fossil Record • Paleontologists (scientists who study fossils) recognize that they are limited to studying tiny and scattered segments on the tree of life, yet they also know that this is the only way to get a glimpse of what extinct life was like •There are several limitations of the fossil record: 1. Habitat bias occurs because organisms that live in areas where sediments are actively being deposited are more likely to fossilize than are organisms that live in other habitats
Limitations of the Fossil Record 2. Taxonomic bias is due to the fact that some organisms (e.g., those with bones) are more likely to decay slowly and leave fossil evidence 3. Temporal bias occurs because more recent fossils are more common than ancient fossils 4. Abundance bias occurs because organisms that are abundant, widespread, and present on Earth for a long time leave evidence much more often than do species that are rare, local, or ephemeral
Part 3 – Phylogeny C. Constructing Phylogenetic Trees • When inferring evolutionary relationships, it is useful to know in which clade a shared derived character first appeared • An outgroup is a species or group of species that is closely related to the ingroup, the various species being studied, but has diverged before the ingroup
Constructing Phylogenetic Trees • Systematists compare each ingroup species with the outgroup to differentiate between shared derived and shared ancestral characteristics characters shared by the outgroup and ingroup are ancestral characters that predate the divergence of both groups from a common ancestor