Download
1 / 68
680 likes | 865 Views
An Overview of Performance Dashboards. Presented by: Desiree A. Crevecoeur-MacPhail, Ph.D. Research Psychologist, UCLA ISAP Loretta L. Denering, M.S. Project Director, UCLA ISAP. UCLA. Why Conduct this Training?. To review purpose of Los Angeles County Evaluation System (LACES)

E N D
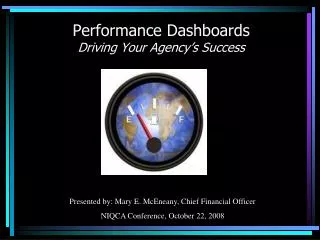
An Overview ofPerformance Dashboards Presented by:Desiree A. Crevecoeur-MacPhail, Ph.D. Research Psychologist, UCLA ISAP Loretta L. Denering, M.S. Project Director, UCLA ISAP UCLA
Why Conduct this Training? To review purpose of Los Angeles County Evaluation System (LACES) To review the recently implemented Performance Dashboards To review the purpose of the Dashboard and how to interpret and utilize the information it contains
What do We Hope You Will Gain • By the end of this training, providers will: • Be more aware of what LACES is and does • Understand some terms used in program evaluation • Understand how to read and interpret the Dashboards • Be aware of the benchmarks and how they are being used to assess performance for outpatient counseling programs
EVALUATING LOS ANGELES COUNTY SUBSTANCE USE DISORDER SERVICES LACES and LACPRS
Los Angeles County Evaluation System (LACES) Evaluation of adult alcohol and other drug services provided by the Los Angeles County. Data analysis, reports, articles Training, presentations and conferences Development and implementation of surveys & tools Partnership between SAPC, contractors for SAPC services, and UCLA/ISAP. On-going evaluation, not a temporary study.
Purpose of LACES Evaluate LA County substance use disorder treatment services Assess treatment outcomes and program performance Disseminate evaluation data to the public Evaluate and explore innovative programs Analyze and report on drug trends See www.LACES-UCLA.org for more info
Los Angeles County Participant Reporting System (LACPRS) LACPRS is the key to evaluating substance use treatment among those using County services All agencies are contractually required to input specific data into the LACPRS database For LACPRS to be effective, agencies MUST input data completely, accurately, and timely for every client!
LACPRS Admission & Discharge (A/D) • LACPRS A/D has 141 questions • Questions 1-32: basic demographic asked once • Questions 33-141: information asked at admission, and again at discharge • LACPRS is ONLY for treatment services, not prevention or DUI (adolescent programs have different set of questions) • Provides data on those admitted to County funded AOD treatment
LACPRS Admission and Discharge • Data from LACPRS A/D informs the following evaluation documents • Site Reports • Performance Dashboards • Annual Reports
ASSESS TREATMENT OUTCOMES AND PROGRAM PERFORMANCE SITE REPORTS AND DASHBOARDS
Important Terms • Four important terms: • Client/Treatment Outcomes • Program Performance • Engagement • Retention
Difference betweenOutcomes and Performance • Client Outcomes • Client Outcomes are the result of what programs do • Can be measured • Examples: Changes in drug use and employment • Program Performance • Program Performance refers to areas that are under the control of the program • Can be measured • Examples: Length of stay and perception of care
Site Reports Details of Content and Use
What is a Site Report? Brief: six pages, double-sided. Information is gathered from the admission & discharge LACPRS. Information is included on each agency site and for all sites of the same program type (e.g. outpatient, residential, etc).
More on Site Reports • Snapshot of program functioning and short-term treatment outcomes. • Based on LACPRS admission & discharge data. • Are used to provide information ONLY • Divided into two sections: • Executive Summary • Full Report
Purpose of Site Report To provide information concerning key performance/outcome areas. To provide feedback to sites concerning how they are performing with regards to the focus areas of the evaluation. To report how other, similar programs are performing.
Contents of the Site Report Executive Summary Admission and discharge totals. Information on program functioning and treatment outcomes. Full Report Includes demographic information. Includes more details on treatment outcomes. Charts showing admission to discharge changes in various areas covered by the LACPRS.
Site Reports and LACPRS • Site Report Information is based on LACPRS • Late data or inaccurate data input at admission and discharge will affect results • Engagement of clients is critical • Conducting Exit Interviews are essential • Compares measures/indicators input at admission with those at discharge • Lack of exit interviews impact accuracy of performance measures and program outcomes
Performance Dashboards What are they? How were they developed? How are they used? How do you gain access?
What is a Dashboard? • Similar to a report card • An easy to read summary (typically single page) • Provides information on provider performance based on the identified measures • Dashboard is based solely on LACPRS information input by the agency.
Difference betweenSite Reports and Dashboards • Site Reports • Multi-page • Info on outcomes and some performance measures • No benchmarks or required level of achievement • Dashboards • Single page – in some cases • Info only on performance measures • Includes benchmarks and there is a Required level of achievement
Similarities between Site Reports and Dashboards • Accurate and timely data entry are important. • Inaccurate data will result in • Incorrect reports (Site Reports/Dashboards) • Delayed payments • Late data will result in • Incorrect reports • Both reports only available to the executive directors and their designees • If you need access, the executive director must contact Richard Lugo
Terminology Review • Performance Measure: An indicator used to assess a provider's delivery of care as it conforms to guidelines or standards of quality. • Focus on program functioning • Performance measures do not directly measure these outcomes.
More Terminology Review • Performance Benchmark: A level of achievement in reaching the goal for a performance measure that generally represents an industry-best standard. • For SAPC that industry-based standard is the average performance for all providers • Adherence to performance benchmarks is expected to lead to desirable outcomes
Performance Measure (PM) Development A list of possible PMs were distributed to contracted treatment providers Meetings were held to discuss potential PMs, availability of the data and their utility Once performance measures were settled, data examined to determine benchmark Settled on three initial performance measures - for outpatient counseling (OC) ONLY Day Care Habilitative included with OC
Performance Measure (PM) Development • Performance Measures agreed upon: • 30 Day Length of Stay (Engagement) • 90 day length of stay (Retention) • Exit Interviews • All of these performance measures were familiar to provides since they are included in site reports
Why Engagement? • In AOD treatment, a significant proportion of patients leave treatment during the first four weeks • Engagement = first 30 days in treatment • Typically includes at least 4 contacts • Low engagement may indicate problems with intake process, counselor rapport development, program process or policies
Why 30 Days? • Most of the questions on the LACPRS that we use to measure outcomes have a 30 day time frame. For example • How many days in the last 30 did you… • This time frame is used at admission and discharge • If clients are not engaged for at least 30 days, the time frame of the questions asked at discharge overlap the time period covered at admissions
Why Retention? • Research shows that without an adequate amount of time in treatment, few improvements are found • 90 days is the magic number • Retention = 90 days or more in treatment • Low retention rates may indicate problems with treatment process (e.g., redundant), lack of rapport, inappropriate or ineffective policies for dealing with relapse, etc.
Interviews Responses to all discharge LACPRS questions. One of the most important of the PMs Information from both admission and discharge is required to measure treatment effectiveness No exit interviews = No measurement of changes that occurred during treatment
Impact of Exit Interviews and 30- days LOS Data • Program ABC has 20 individuals discharged • 15 completed exit interviews • 10 of the 15 were in treatment at least 30 days • ONLY have valid outcome data for 10 of the 20 discharged individuals • Only those in treatment at least 30 days and who have completed exit interviews will have data that can show changes that occurred during treatment
Performance Benchmarks • Once PM were agreed upon, benchmarks were developed • Standard levels of expected performance • SAPC benchmarks are based on average from outpatient programs for the prior three years • 30 Day Length of Stay = 80% • 90 Day Retention = 65% • Exit Interviews = 50% • Benchmarks are reported via “Dashboards”
HOW TO READ DASHBOARDS • Three (or four) sections of dashboard • Introduction • Results • Next Steps (for fell below benchmark) • Definitions
HOW TO READ DASHBOARDIntroduction Performance Dashboard Outpatient Counseling Program 1234 Any Street, Los Angeles, CA 90025 This dashboard provides information concerning how well this program is performing relative to the established performance benchmarks. Providers are expected to reach or exceed the performance benchmark. Those programs that do not reach the performance benchmark may be offered training and technical assistance. It is the responsibility of the agency to ensure that these numbers are reviewed on a quarterly basis and to contact the County if the performance of this program falls short. According to this information, nothing further is required of your program at this time.
HOW TO READ DASHBOARDIntroduction Performance Dashboard Outpatient Counseling Program 1234 Any Street, Los Angeles, CA 90025 This dashboard provides information concerning how well this program is performing relative to the established performance benchmarks. Providers are expected to reach or exceed the performance benchmark. Those programs that do not reach the performance benchmark may be offered training and technical assistance. It is the responsibility of the agency to ensure that these numbers are reviewed on a quarterly basis and to contact the County if the performance of this program falls short. According to this information, nothing further is required of your program at this time.
HOW TO READ DASHBOARDIntroduction • Two main areas to note on all dashboards • The underlined comment above the table • The table at the top of the dashboard
HOW TO READ DASHBOARDIntroduction Performance Dashboard Outpatient Counseling Program 1234 Any Street, Los Angeles, CA 90025 This dashboard provides information concerning how well this program is performing relative to the established performance benchmarks. Providers are expected to reach or exceed the performance benchmark. Those programs that do not reach the performance benchmark may be offered training and technical assistance. It is the responsibility of the agency to ensure that these numbers are reviewed on a quarterly basis and to contact the County if the performance of this program falls short. According to this information, nothing further is required of your program at this time.
HOW TO READ DASHBOARDIntroduction Performance Dashboard Outpatient Counseling Program 1234 Any Street, Los Angeles, CA 90025 This dashboard provides information concerning how well this program is performing relative to the established performance benchmarks. Providers are expected to reach or exceed the performance benchmark. Those programs that do not reach the performance benchmark may be offered training and technical assistance. It is the responsibility of the agency to ensure that these numbers are reviewed on a quarterly basis and to contact the County if the performance of this program falls short. According to this information, nothing further is required of your program at this time.
HOW TO READ DASHBOARDIntroduction • Performance table divided into 5 columns that provide information on discharged clients entered into LACPRS. • These columns include: • Performance measure • Report Quarter • Total for Fiscal Year by Quarter (%) • Cumulative Performance (%) • Performance Benchmark (%)
HOW TO READ DASHBOARDIntroduction Performance Dashboard Outpatient Counseling Program 1234 Any Street, Los Angeles, CA 90025 This dashboard provides information concerning how well this program is performing relative to the established performance benchmarks. Providers are expected to reach or exceed the performance benchmark. Those programs that do not reach the performance benchmark may be offered training and technical assistance. It is the responsibility of the agency to ensure that these numbers are reviewed on a quarterly basis and to contact the County if the performance of this program falls short. According to this information, nothing further is required of your program at this time.
HOW TO READ DASHBOARDIntroduction Performance Dashboard Outpatient Counseling Program 1234 Any Street, Los Angeles, CA 90025 This dashboard provides information concerning how well this program is performing relative to the established performance benchmarks. Providers are expected to reach or exceed the performance benchmark. Those programs that do not reach the performance benchmark may be offered training and technical assistance. It is the responsibility of the agency to ensure that these numbers are reviewed on a quarterly bass and to contact the County if the performance of this program falls short. According to this information, nothing further is required of your program at this time.
HOW TO READ DASHBOARDIntroduction Table provides info on • Performance measures and benchmarks • Benchmarks based on County average for outpatient counseling programs • Current Quarter Discharges • Number of discharges for the reporting quarter • Report Quarter (QTR) N • Number of clients who met the performance measure
HOW TO READ DASHBOARDIntroduction Performance Dashboard Outpatient Counseling Program 1234 Any Street, Los Angeles, CA 90025 This dashboard provides information concerning how well this program is performing relative to the established performance benchmarks. Providers are expected to reach or exceed the performance benchmark. Those programs that do not reach the performance benchmark may be offered training and technical assistance. It is the responsibility of the agency to ensure that these numbers are reviewed on a quarterly basis and to contact the County if the performance of this program falls short. According to this information, nothing further is required of your program at this time.
HOW TO READ DASHBOARDIntroduction • Total for Fiscal Year by Quarter • The number in these boxes are PERCENTAGES • They tell us what percentage of discharged clients met the performance measure. • In this case, 100% of discharged clients remained in treatment at least 30 days. • Agencies would compare the percent for each quarter with the performance benchmark at the end of the table.
HOW TO READ DASHBOARDIntroduction Performance Dashboard Outpatient Counseling Program 1234 Any Street, Los Angeles, CA 90025 This dashboard provides information concerning how well this program is performing relative to the established performance benchmarks. Providers are expected to reach or exceed the performance benchmark. Those programs that do not reach the performance benchmark may be offered training and technical assistance. It is the responsibility of the agency to ensure that these numbers are reviewed on a quarterly basis and to contact the County if the performance of this program falls short. According to this information, nothing further is required of your program at this time.
HOW TO READ DASHBOARDIntroduction Performance Dashboard Outpatient Counseling Program 1234 Any Street, Los Angeles, CA 90025 This dashboard provides information concerning how well this program is performing relative to the established performance benchmarks. Providers are expected to reach or exceed the performance benchmark. Those programs that do not reach the performance benchmark may be offered training and technical assistance. It is the responsibility of the agency to ensure that these numbers are reviewed on a quarterly basis and to contact the County if the performance of this program falls short. According to this information, nothing further is required of your program at this time.
HOW TO READ DASHBOARDResults • The narrative description of the data is below the performance table under the section “Results” • There are two periods in which results are listed: • Current Quarter • Cumulative Results • There are two types of results: • Met/exceeded • Not met
HOW TO READ DASHBOARDResults RESULTS Current Quarter • This program has met/exceeded the County Benchmarks for 30 Day LOS. • This program has met/exceeded the County Benchmarks for 90 Day LOS. • This program has met/exceeded the County Benchmark for Exit Interviews. Cumulative Results (Year to Date) • This program has met/exceeded the County Benchmarks for 30 Day LOS. • This program has met/exceeded the County Benchmarks for 90 Day LOS. • This program has met/exceeded the County Benchmark for Exit Interviews.