Download
1 / 53
540 likes | 754 Views
The Obesity Epidemic. Obesity is a chronic disease … that is replacing more traditional public health concerns … as one of the most significant contributors to ill health. WHO (2000). epidemic ( ερι d ε m ι k)

E N D
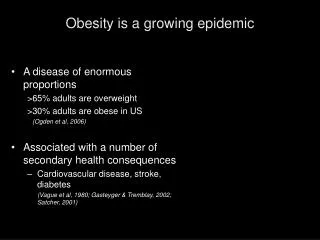
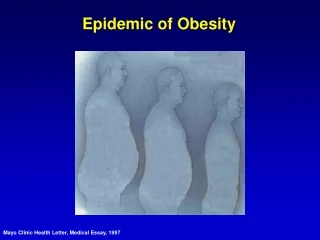
TheObesity Epidemic
Obesity is a chronic disease … that is replacing moretraditional public health concerns … as one of the mostsignificant contributors to ill health.WHO (2000)
epidemic (εριdεmιk) 1. noun a widespread occurrence of an infectious disease in a community at a particular time. 2. noun a sudden, widespread occurrence of something undesirable. 3. noun a rapid development, spread, or growth of something. Oxford English Dictionary
No data < 10% 10-14.9% 15-19.9% 20-24.9% > 25% Obesity Trends by StateBehavioral Risk Factor Surveillance SystemUS National Center for Chronic Disease Prevention and Health Promotion
No data < 10% 10-14.9% 15-19.9% 20-24.9% > 25% 1985
No data < 10% 10-14.9% 15-19.9% 20-24.9% > 25% 1986
No data < 10% 10-14.9% 15-19.9% 20-24.9% > 25% 1987
No data < 10% 10-14.9% 15-19.9% 20-24.9% > 25% 1988
No data < 10% 10-14.9% 15-19.9% 20-24.9% > 25% 1989
No data < 10% 10-14.9% 15-19.9% 20-24.9% > 25% 1990
No data < 10% 10-14.9% 15-19.9% 20-24.9% > 25% 1991
No data < 10% 10-14.9% 15-19.9% 20-24.9% > 25% 1992
No data < 10% 10-14.9% 15-19.9% 20-24.9% > 25% 1993
No data < 10% 10-14.9% 15-19.9% 20-24.9% > 25% 1994
No data < 10% 10-14.9% 15-19.9% 20-24.9% > 25% 1995
No data < 10% 10-14.9% 15-19.9% 20-24.9% > 25% 1996
No data < 10% 10-14.9% 15-19.9% 20-24.9% > 25% 1997
No data < 10% 10-14.9% 15-19.9% 20-24.9% > 25% 1998
No data < 10% 10-14.9% 15-19.9% 20-24.9% > 25% 1999
No data < 10% 10-14.9% 15-19.9% 20-24.9% > 25% 2000
No data < 10% 10-14.9% 15-19.9% 20-24.9% > 25% 2001
No data < 10% 10-14.9% 15-19.9% 20-24.9% > 25% 2002
No data < 10% 10-14.9% 15-19.9% 20-24.9% > 25% 2003
No data < 10% 10-14.9% 15-19.9% 20-24.9% > 25% 2004
W 32 W 31 W 30 Median BMI > 30 kg/m2 29 W 28 W 27 26 W 25 W 24 W 1994 1995 1996 1997 1998 1999 2000 Obesity Trends Among U.S. AdultsNational Health and Nutrition Examination Survey(Based on measured weights and heights)
Obesity Trends U.K. versus U.S. AdultsHealth Survey for England 2004 36 USA 34 32 UK 30 28 Median BMI > 30 kg/m2 26 24 22 20 18 16 14 1993 1994 1995 1996 1997 1998 1999 2000 2001 2002 2003 2004
Females 26 24 Males 22 Median BMI > 30 kg/m2 20 18 16 14 12 1993 1994 1995 1996 1997 1998 1999 2000 2001 2002 2003 2004 Obesity Trends U.K. Males versus FemalesHealth Survey for England 2004
Should the scenarios relating to obesity turn out to be true, the sight of amputees will become much more familiar in the streets of Britain.There will be many more blind people. There will be huge demandfor kidney dialysis. The positive trends of recent decades in combatingheart disease will be reversed. Indeed, this will be the first generationwhere children die before their parents as a consequence of childhoodobesity. House of Commons Health Select Committee on Obesity (2004)
30 25 12 % obese 15 10 5 1973 1993
6 – 11 yrs 20 18 12 – 19 yrs 16 14 % BMI > sex and age-related 95th percentile 12 10 8 6 4 1964 1968 1972 1976 1980 1984 1988 1992 1996 2000 2004 Obesity Trends Among U.S. Children and AdolescentsNational Health and Nutrition Examination Survey
Energy Imbalance Energy intake vs energy expended Positive energy balance: intake persistently exceeds output
Positive Energy Balance 1. Why do some people maintain a state of positive energy balance while others regulate intake against expenditure? 2. Are many more people in a state of positive energy balance now than in the past, and if so, why?
1. Why do some people maintain a state of positive energy balance while others regulate intake against expenditure?
Genetic Predisposition 70% + of variation in adiposity attributable to heredity Some evidence that obese people more responsiveto food cues and less responsive to satiety signals Could be result of disruption of normal regulatoryprocesses as a result of repeated attempts to restrictfood intake Food has greater reinforcing value among the obese
Positive Energy Balance 2. Are many more people in a state of positive energy balance now than in the past, and if so, why?
People tend to eat more when food is : Cheap Easily accessible More palatable More variedServed in larger portionsEnergy denseKral & Rolls (2004) The Obesogenic Environment
What we should eat versus what is advertised For every £1 spent by WHO promoting healthy diets, £500 is spent by the food industry promoting unhealthy foods
International Cocoa Organisation (2000) www.icco.org “The growth (in chocolate sales) has been attributedto constant innovation and an increase in impulsesnacking by consumers. Advertising and promotionare crucial in maintaining these factors.”
Association between number ofadverts for sweet/fatty foods onchildren’s TV and prevalence ofoverweight7 EU countries, USA, Australiar = .86Lobstein & Dibb (2005)
Association between number ofadverts for healthy foods onchildren’s TV and prevalence ofoverweight7 EU countries, USA, Australiar = -.56 Lobstein & Dibb (2005)
Increased Food Consumption No overall change in food energy intake between 1965 – 1995 Jeffery & Utter (2003) Increases in under-reporting food intake Increases in portion sizes (not picked up my measurement methods) More food eaten away from home (less reliable measurement)
Decreased Physical Activity No reliable comparable data available pre - 1980 1980-1995: no change in leisure-time physical activity 1990 – 2004: slight increases in leisure-time physical activity and decrease in proportion of sedentary people
Obesity Leisure-time activity Energy intake Time
Physical activity has been engineered out of daily life The extra physical activity involved in daily living 50 years agocompared with today was the equivalent to running a marathona week Tackling Obesity in England NAO (2001)