Download
1 / 16
220 likes | 629 Views
Performance Analysis and Tuning. Presented by Carol Thornborrow. System Performance. User “perceived performance”. System performance is the efficiency which system resources respond to current demands on the system.

E N D
Performance Analysis and Tuning • Presented by Carol Thornborrow
System Performance • User “perceived performance”
System performance is the efficiency which system resources respond to current demands on the system. Service Level Agreement (SLA) - Agreement between management, the user community and the information technology staff. System Performance
System Performance • What is “normal”? • Create a baseline for comparison.
Monitoring • Resources which affect system performance • CPU • Memory • Disk I/O • Network I/O • Resources affect on system performance • Not enough of the resource • Allocation of the resource is being mismanaged
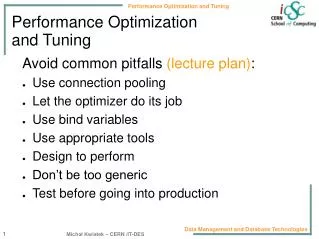
Monitoring • Identifying bottlenecks • What is the problem? • Identify the Cause • What will it take to fix? • Is the problem fixed? • Reevaluate, start over • Monitoring Tools • OS utilities • vmstat, netstat • Vendor products • GlancePlus, SarCheck
Monitoring - CPU • Overall utilization • vmstat on most systems • sar –u Solaris and HP-UX • Load Average • uptime • Per process CPU time • ps –elf on HP-UX, Solaris • ps –aux on Red Hat, Free BSD • top - real time • pstree • init-+-alarmd |-7*[kdeinit]
vmstat 5 4 procs cpu r b w us sy id 1 0 0 3 5 92 0 0 0 0 1 99 0 0 0 0 1 99 0 0 0 2 0 98 r > 3-6/CPU us + sy > 80% sar –u 5 4 %usr %sys %wio %idle 0 0 0 100 0 1 1 98 0 0 0 100 0 0 0 100 Average 0 0 0 99 Monitoring - CPU
Tuning - CPU • Manually change priority • System V, Free BSD • renice new nice# pid • Solaris also has • priocntl –s –p new-pri –i pid proc-id • Replace CPU • Add CPU • Redistribute load • At – run process at specific time • Batch – run processes sequentially • Idle CPU
Monitoring - Memory • Active virtual memory • Solaris swap –l or sar -r • HP-UX swapinfo • Free BSD pstat -s • Red Hat swapon –s • Paging rate • vmstat • # of running processes • vmstat • Swaps • vmstat
Monitoring - Memory • vmstat 5 4 r w swap free re po 0 0 509552 38512 7 0 0 0 445184 35600 0 0 0 0 445184 35600 0 0 0 0 445184 35600 0 0 • sar –r 5 4 16:03:06 freemem freeswap 16:03:11 4413 888080 16:03:16 4409 888080 16:03:21 4409 888080 16:03:26 4409 888080
Tuning – Memory • Add more memory • Distribute swap space • Distribute jobs – at, batch • Virtual memory and paging • Free BSD sysctl • Increase vm.v_cache_min and/or vm.v_cache_max to favor fs buffer cache over user processes
Avg size of transfers iostat dad0 kps tps 4 1 94 26 kps/tps = Kb/transfer % of disk utilization iostat –D ssd0 rps wps util 0 7 4.2 0 8 2.6 System V sar –d Need accounting turned on May affect performance Monitoring – Disk I/O
Tuning – Disk I/O • Spread active files over several disks and controllers • Sequential files are contiguous and near outer edge of disk • Place randomly accessed files near center of disk • Place root system on own disk if possible • Disk striping • Purchase fast disks w fast controllers
netstat –i Collisions > 5% of total calls ping nfsstat –c retrans > 5% of calls badxid = retrans -> server badxid < retrans -> network Spread the network load between servers Add more bandwidth Monitoring and Tuning Network I/O