Download
1 / 14
140 likes | 287 Views
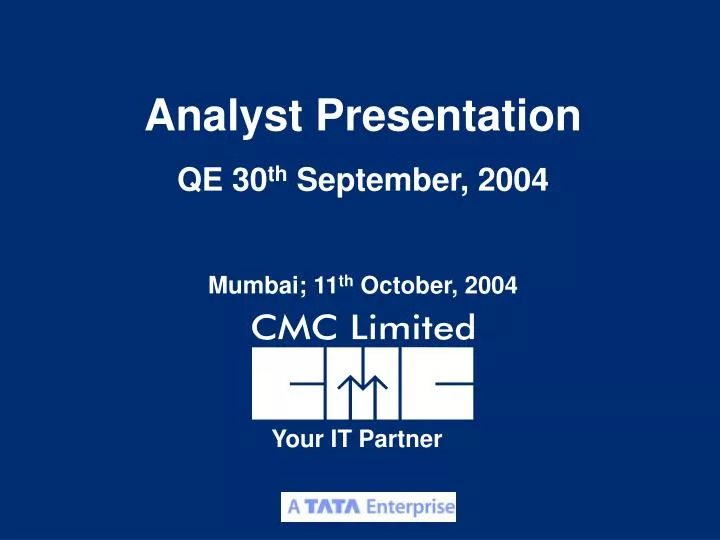
Analyst Presentation QE 30 th September, 2004 Mumbai; 11 th October, 2004. Your IT Partner. Financial Results – H1(FY 2004-05). 5.4%. 51.4%. 84.2%. International Revenue up 53%, Service Revenue up 24% International business share in overall revenue increased from 17% to 25%.

E N D
Analyst Presentation QE 30th September, 2004 Mumbai; 11th October, 2004 Your IT Partner
Financial Results – H1(FY 2004-05) 5.4% 51.4% 84.2% • International Revenue up 53%, Service Revenue up 24% • International business share in overall revenue increased from 17% to 25%
Financial Results – Q2 (FY 2004-05) -3.8% 29.2% 50.9% • International Revenues at Rs. 43.1 crs up 44% y-o-y. Share of international revenue increased from 16% to 24%. • Service Revenue growth of 22% y-o-y. • Profitability improvement due to improvement in revenue mix towards more value added business and international revenue.
Segmental Revenue – Q2 (FY 2004-05) Our International business continues to perform strongly
International Revenue – Q2 (FY 2004-05) Increased success in high value software solutions business in the international market
Margins – Q2 (FY 2004-05) Margin expansion fuelled by Increase in international business and higher value add domestic business
Productivity Indices – Q2 (FY 2004-05) (Th./Rs.) (Th./Rs.) (Times) All round improvement in manpower utilization and productivity
Strategic Shift • Improve revenue mix: • Increase International Revenues (increased from 16% to 24% in H1) • Defocus from pure equipment business unless accompanied by service business • Service revenues are up by 24% in H1 • Equipment business down 9% in H1 • Build sustained service revenue stream around niche areas like Embedded systems and CMC’s solutions • Capitalize on resurgent Education and Training market
Debtors Profile – Q2 (FY 2004-05) • Debtors level falls further to Rs. 158 crs. (72 days) from Rs. 170 crs. (79 days) during the quarter
Shareholding Pattern 30.09.2004 30.06.2004