1 / 51

10 pt

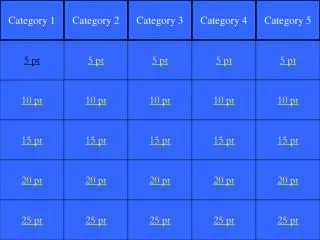
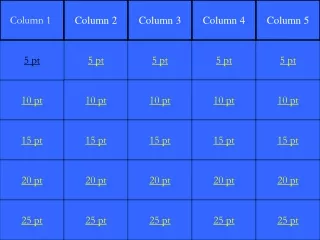
VOCAB. GRAPHS. RANGE. MEDIAN AND MODE. MORE VOCAB!. 5 pt. 5 pt. 5 pt. 5 pt. 5 pt. 10 pt. 10 pt. 10 pt. 10 pt. 10 pt. 15 pt. 15 pt. 15 pt. 15 pt. 15 pt. 20 pt. 20 pt. 20 pt. 20 pt. 20 pt. 25 pt. 25 pt. 25 pt. 25 pt. 25 pt. WHAT IS A PICTOGRAPH?.

Download Presentation

10 pt

An Image/Link below is provided (as is) to download presentation Download Policy: Content on the Website is provided to you AS IS for your information and personal use and may not be sold / licensed / shared on other websites without getting consent from its author. Content is provided to you AS IS for your information and personal use only. Download presentation by click this link. While downloading, if for some reason you are not able to download a presentation, the publisher may have deleted the file from their server. During download, if you can't get a presentation, the file might be deleted by the publisher.

E N D

Presentation Transcript


  1. VOCAB. GRAPHS RANGE MEDIAN AND MODE MORE VOCAB! 5 pt 5 pt 5 pt 5 pt 5 pt 10 pt 10 pt 10 pt 10 pt 10 pt 15 pt 15 pt 15 pt 15 pt 15 pt 20 pt 20 pt 20 pt 20 pt 20 pt 25 pt 25 pt 25 pt 25 pt 25 pt

  2. WHAT IS A PICTOGRAPH?

  3. A PICTOGRAPH USES PICTURES OR SYMBOLS TO SHOW DATA.

  4. WHAT IS A BAR GRAPH?

  5. A BAR GRAPH USES VERTICAL OR HORIZONTAL BARS TO SHOW DATA.

  6. WHAT IS A LINE PLOT?

  7. A LINE PLOT USES SYMBOLS ABOVE A NUMBER LINE TO SHOW DATA.

  8. WHAT ARE COORDINATES?

  9. ORDERED NUMBER PAIR USED IN GRAPHING.

  10. WHAT IS SCALE?

  11. THE MARKED INTERVALS ON A GRAPH.

  12. What type of graph is this?

  13. Bar graph!!!

  14. Name the following graph.

  15. Line graph.

  16. Name the type of graph that uses pictures!

  17. Pictograph

  18. What are stems? What are leaves? NOT THESE!

  19. Stems = tens Leaves= ones

  20. If you wanted to graph the trend in weather for the month of September. Which graph would be best?

  21. Line graph!

  22. WHAT IS THE RANGE OF THESE NUMBERS? 4, 5, 5, 5, 7, 7, 7, 99, 99, 78, 78, 56

  23. 95

  24. Define range.

  25. Range is the difference between the greatest number and the least number.

  26. Find the range in the following data. 3, 4, 8, 7, 8, 2, 1, 10, 11, 3, 5, 6, 3

  27. 10

  28. Find the range in the following data. 2, 4, 6, 7, 4, 26, 78, 3, 5, 89, 4, 6, 9, 11, 12, 14, 54, 4, 5, 7,

  29. 87

  30. Find the range. 67, 68, 98, 34, 66, 33, 10, 78, 324, 64, 98, 11

  31. 314

  32. What is the median for the following. 2, 2, 3, 4, 5, 5, 6, 7, 7, 8, 8, 9, 9, 9, 9,

  33. 7

  34. What is the median? 1, 1, 1, 2, 2, 2, 3, 3, 5, 5, 6, 6,

  35. 2.5

  36. What is the mode? 1, 1, 1, 1, 2, 2, 2, 4, 4, 4, 5, 5, 5, 6, 6, 6, 6, 6, 6, 7, 7, 8, 8, 8, 8, 8, 8, 8, 9,

  37. 8

  38. What is the mode? 12, 12, 12, 12, 14, 14, 15, 15, 15, 15, 17, 17, 17, 17, 17, 17, 17, 17, 17, 18, 18, 18, 18, 18, 18, 18, 18, 18, 18, 18, 19, 19

  39. 18

  40. True or false- mode means the difference between the largest and smallest number.

  41. False -it is the number that occurs most in a set of data.

  42. WHAT IS A LINE GRAPH?

  43. A GRAPH THAT SHOWS INCREASES OR DECREASES OVER TIME.

  44. WHAT IS AN INTERVAL?

  45. THE FIXED DISTANCE BETWEEN THE NUMBERS ON THE SCALE OF A GRAPH.

  46. WHAT IS A VERTICAL AXIS?

  47. THE UP-AND-DOWN LINE ON A GRAPH.

  48. WHAT IS A HORIZONTAL AXIS?

  49. LEFT-TO-RIGHT NUMBER LINE ON A GRAPH.

  50. WHAT IS A STEM –AND- LEAF PLOT?

More Related