Download

1 / 9
90 likes | 510 Views
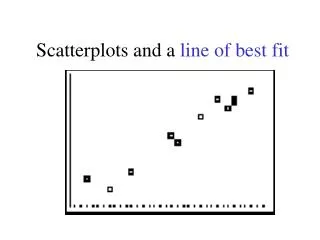
Line of Best fit, slope and y-intercepts. MAP4C. Best fit lines. A line of best fit is a line drawn through data points that represents a linear relationship between 2 variables. This is also called a trend line or regression line.

E N D
Best fit lines • A line of best fit is a line drawn through data points that represents a linear relationship between 2 variables. • This is also called a trend line or regression line. • The line of best fit isn’t just drawn through the middle of the data: it needs to be closest to each point. • In a scatter plot, a point that lies off the best fit line is called an outlier. • Outliers may be from bad data, an error or is just unusual. (The outliers should be considered in a line of best fit!)
The effects of outliers • Which graph is the line of best fit? Justify your choice. A B C • Graph C is the best line of best fit. • The two outliers pull the line down slightly, not as much as in Graph B. • Graph A ignores outliers.
How do you know if the data is linear?? • A linear model may be unreliable if: • There are too few data points. • The model is based on data clustered together. • There does not appear to be any correlation. • There are outliers. • The data do not appear to be linear.
Interpolation and Extrapolation • A line of best fit can be used to predict values. • Estimating values within a set of data is called interpolation. • Estimating values outside a set of data is called extrapolation. (Usually your best fit line needs to be extended)
Example and Review! • In a grade 12 math class: pre-exam marks and exam marks were collected for some students as shown: • Graph the data and draw a line of best fit. • Determine the equation of the line of best fit. • Use the data to predict the exam mark of a student with a pre-exam mark of 98% and 10% • Estimate what pre-exam mark would best match an exam mark of 65%
Example and Review! • Plot the points. Place a ruler on the graph so that it comes close as possible to all the points. Draw a line along the ruler’s edge; connected to the y-axis. • The equation of a line is y = mx + b. Choose two points to find the slope: b is read off the graph at ~7 The equation is y = 0.9x + 7 • Extrapolating: A pre-exam mark of 98% would get ~95% on the exam.If 10%: the exam mark would be ~16%. • Interpolation: An exam mark of 65% (read off y-axis) would yield a pre-exam mark of ~63%
P.S. • Instead of using y and x, other letters may be used to represent equations. • We could have used P and E for the last example to give: E = 0.9P + 7 • We also could have calculated extrapolated or interpolated data by subbing in numbers into our equation: For part c) for P = 10%....... E = 0.9P + 7 = 0.9(10) + 7 = 9 + 7 = 16%
Text work • Page 453 #1-6, 8, 13, 15