Download
1 / 14
140 likes | 350 Views
Week 10. Warm-ups. Agenda. Vocabulary. Biotic : living parts of an ecosystem Abiotic : non-living parts of an ecosystem. Which is most important? Why?. Interdependence. All organisms depend on other organisms Levels: Organism Population (group of similar org. in same place, time)

E N D
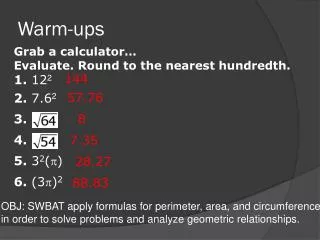
Week 10 Warm-ups
Vocabulary • Biotic: living parts of an ecosystem • Abiotic: non-living parts of an ecosystem Which is most important? Why?
Interdependence All organisms depend on other organisms Levels: • Organism • Population (group of similar org. in same place, time) • Community (all populations in same place, time) • Ecosystem (community/biotic + abiotic factors) • Biome (REGIONAL ecosystem type)
Ecology Vocabulary Producer Primary Consumer Secondary Consumer, etc. (all Decomposer) • Producer = plants produce their own food • Primary Consumer = herbivores • Secondary Consumer, etc. = carnivores • Third, fourth, fifth consumers can exist • Decomposer = bacteria, fungi, etc. that RETURN nutrients to environment to be reused.
Ecosystem: All the natural biotic AND abiotic components of a habitat.
Food Web: Connected Food Chains • Identify 3 food chains from this food web Grass Caterpillar Lizzard Eagle Grass Caterpillar Bluebird Eagle Grass Snail Bluebird Eagle Grass Bluebird Eagle Grass Rabbit Eagle
Food Webs • Food webs show connecting food chains • Always start with PRODUCERS • Plants PRODUCE their own food through photosynthesis… using sunlight energy! • They USE that food, but consumers also eat them which starts the food chain • Then CONSUMERS (primary, secondary, etc.) • Omnivores can be Primary Consumers in one food chain and Secondary Consumers in a second one within one food web. • DECOMPOSERS break down anything that dies and returns nutrients to the environment
Numbers Pyramid Fewer organisms Consumers More organisms Producers (mostly plants)
Energy Pyramid Less energy More energy
Energy or Numbers Pyramid? • Quarternary consumer: osprey (sea bird) • Tertiary consumer: fish • Secondary consumer: zooplankton (krill) • Primary consumer: daphnia (water flea) • Producer: algae
Population Sizes The following affect the size of a population: • Limiting factors(+ or-) • Food, Water, Shelter/space, Weather • Birth rate (+) • Death rate (-) • Immigration (+) (Im… means INTO) • Emigration (-) (E… means OUT OF) If birth rate > death rate and immigration > emigration the population will grow, and vice versa.
Deer Population Game • There will be 2 lines: • Deer • Limiting Resources • Deer will turn away while Resources get a card: • Food, Water, OR Shelter • I will tell what happened that year and which resource the deer are in search of, then count: 1… 2… 3… GO! The deer then have to find that resource, hold their hand, and bring them back. • If a deer doesn’t find the resource they die, decompose and return to nature, in the resource line. Resources that have gone to the deer line have now become deer (to show births). • Play continues
Graphing • A.C.E. = Answer the Question, Cite Data to prove it, Explain the data and why you think the trend happened. • Identify a TREND on the graph = MULTIPLE years in a row that the population continues to inc., dec., or remain the same • Include data. Identify the years the trend occurs over, and tell how much the population changed by. EXAMPLE: From year 5 to year 10 the rabbit population increased by 12 rabbits.