Download
1 / 1
10 likes | 121 Views
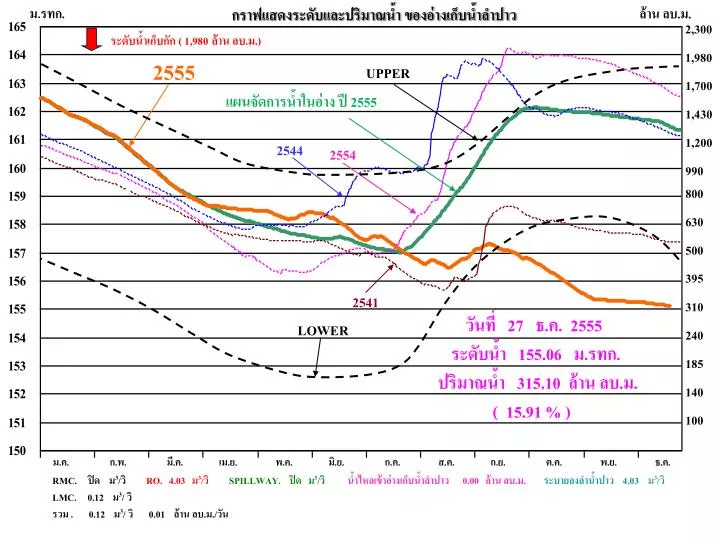
ม . รทก. กราฟแสดงระดับและปริมาณน้ำ ของอ่างเก็บน้ำลำปาว. ล้าน ลบ.ม . 2 ,300. ระดับน้ำเก็บกัก ( 1,980 ล้าน ลบ.ม.). UPPER. 1 ,980. 2555. 1,700. แผนจัดการน้ำในอ่าง ปี 2555. 1,430. 1,200. 2554. 2544. 990. 800. 630. 500. 395. 2541.

E N D
ม.รทก. กราฟแสดงระดับและปริมาณน้ำ ของอ่างเก็บน้ำลำปาว ล้าน ลบ.ม. 2,300 ระดับน้ำเก็บกัก ( 1,980ล้าน ลบ.ม.) UPPER 1,980 2555 1,700 แผนจัดการน้ำในอ่าง ปี 2555 1,430 1,200 2554 2544 990 800 630 500 395 2541 310 LOWER วันที่ 27 ธ.ค. 2555 ระดับน้ำ 155.06 ม.รทก. ปริมาณน้ำ 315.10 ล้าน ลบ.ม. ( 15.91 % ) 240 185 140 100 ม.ค. ก.พ. มี.ค. เม.ย. พ.ค. มิ.ย. ก.ค. ส.ค. ก.ย. ต.ค. พ.ย. ธ.ค. RMC. ปิด ม3/วิ RO. 4.03 ม3/วิSPILLWAY. ปิด ม3/วิน้ำไหลเข้าอ่างเก็บน้ำลำปาว 0.00 ล้าน ลบ.ม.ระบายลงลำน้ำปาว4.03 ม3/วิ LMC. 0.12 ม3/ วิ รวม . 0.12 ม3/ วิ 0.01 ล้าน ลบ.ม./วัน