Download
1 / 18
180 likes | 366 Views
The Influence of Lateral and Top Boundary Conditions on Regional Air Quality Prediction: a Multi-Scale Study Coupling Regional and Global Chemical Transport Models

E N D
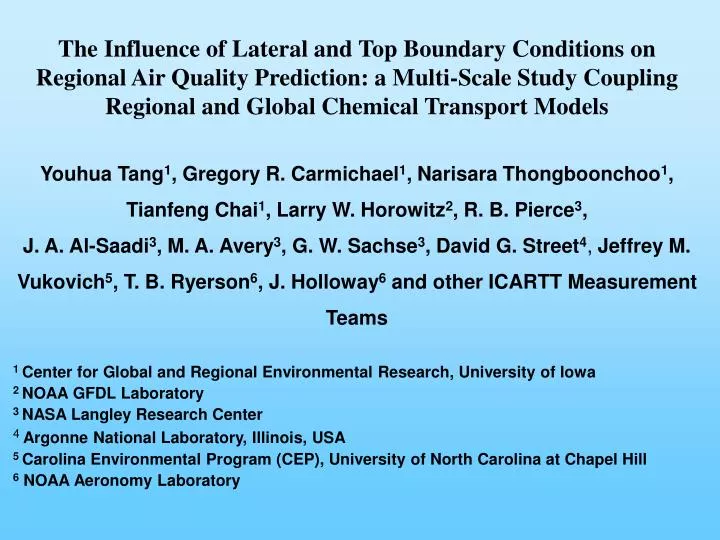
The Influence of Lateral and Top Boundary Conditions on Regional Air Quality Prediction: a Multi-Scale Study Coupling Regional and Global Chemical Transport Models Youhua Tang1, Gregory R. Carmichael1, Narisara Thongboonchoo1, Tianfeng Chai1, Larry W. Horowitz2, R. B. Pierce3, J. A. Al-Saadi3, M. A. Avery3, G. W. Sachse3, David G. Street4, Jeffrey M. Vukovich5, T. B. Ryerson6, J. Holloway6and other ICARTT Measurement Teams 1 Center for Global and Regional Environmental Research, University of Iowa 2 NOAA GFDLLaboratory 3 NASA Langley Research Center 4 Argonne National Laboratory, Illinois, USA 5 Carolina Environmental Program (CEP), University of North Carolina at Chapel Hill 6 NOAA Aeronomy Laboratory
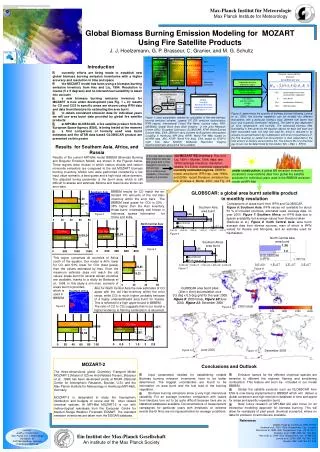
Most regional air quality/chemical transport models use typical concentration profiles as their boundary conditions. These predefined boundary conditions determine the model’s background concentration, inflow airmass characteristics and associated ambient reactions and products. This kind of boundary conditions usually lacks temporal and spatial variations. • STEM simulations for ICARTT field experiment (July-August, 2004) were tested with the top and lateral boundary conditions from 3 global chemical transport models (MOZART-NCAR, MOZART-GFDL and RAQMS), and these results were compared with ICARTT aircraft measurements. • We utilize this experiment to examine the impacts of temporal and spatial variations in the boundary conditions’ on model performance. This sensitivity study was performed in 60km and nested 12km STEM domains from July-August, 2004 over North America.
MOZART-NCAR MOZART-GFDL RAQMS Top & Lateral BCs (NCAR) Top & Lateral BCs (GFDL) Top & Lateral BCs (RAQMS) STEM 60km Simulation with NCAR BCs STEM 60km Simulation with GFDL BCs STEM 60km Simulation with RAQMS BCs Comparison and Analysis for ICARTT period Temporal Averaging Spatial Averaging Time-fixed BCs Profile BCs STEM 60km Simulation with Time-fixed BCs STEM 60km Simulation with Profile BCs Comparison and Analysis for ICARTT period Time-varied BCs for the 12km domain Time-fixed BCs for the 12km domain Profile BCs for the 12km domain Temporal Averaging Spatial Averaging Nested 12km Simulation with Time-varied Original BCs 12km Simulation with Time-fixed BCs 12km Simulation with Profile BCs Analysis Framework
MOZART-NCAR MOZART-GFDL RAQMS Mean O3 top boundary conditions (ppbv) during the ICARTT period
Mean Lateral-Boundary CO (ppbv) from MOZART-NCAR Mean Lateral-Boundary CO (ppbv) from MOZART-GFDL Mean Lateral-Boundary CO (ppbv) from RAQMS
Simulations with MOZART-GFDL and RAQMS boundary conditions tend to overpredict O3 near top troposphere in this scenario Observed and Simulated O3 and CO concentrations for the DC-8 flight 8 on 07/15/2004
MOZART-NCAR MOZART-GFDL RAQMS MOZART-NCAR MOZART-GFDL RAQMS O3 (ppbv) CO (ppbv) STEM 60km simulated O3 and CO concentration in the 10km layer with boundary conditions in the 10km layer from the three global models for DC-8 flight 8 on July 15 (the upper-left shows the flight path).
MOZART-NCAR STEM 60km simulated O3 and CO oncentrations in the 5.6km layer with boundary conditions from the three global models for WP-3 flight 12 on July 28 (the upper-left plot shows the flight path). MOZART-GFDL RAQMS
Observed and simulated O3, CO, and NOy concentrations for the WP-3 flight 12 on 07/28/2004
Sensitivity of the model to temporal and spatial variations of boundary conditions Observed and simulated CO and O3 concentrations for the WP-3 flight 13 on 07/31- 08/01, 2004
CO (ppbv) O3 (ppbv) Oringal BCs 12km simulated CO (left column) and O3 (right column) concentrations in the 1km layer, at 0 UTC, 08/01/2004, driven by 3 different boundary conditions. The WP-3 flight path is shown in each plot. Time-Fixed BCs Profile BCs
The statistic result of 60km simulations with the three global-model boundary conditions compared with the observations in all ICARTT DC-8 and WP-3 research flights. DC-8 WP-3
Observed and 60km-simulated CO and O3 mean profiles and standard deviations for all DC-8 flights (upper) and WP-3 flights (lower)
The statistic results of 60km and 12km simulations with the original, time-mean and profile boundary conditions compared with the observations in ICARTT DC-8 and WP-3 flights. 60km simulations for DC-8 flights 12km simulations for WP-3 flights
Mean CO difference and profiles of standard deviation near boundaries of the 60km domain 60km Simulated CO near the north boundary 60km Simulated CO near the east boundary 60km Simulated CO near the west boundary 60km Simulated CO near the south boundary Comparison among the original MOZART-NCAR, time-mean and profile boundary Conditions
Mean CO difference and profiles of standard deviation near boundaries of the 12km domain 60km Simulated CO near the north boundary 60km Simulated CO near the east boundary 60km Simulated CO near the south boundary 60km Simulated CO near the west boundary Comparison among the original, time-mean and profile boundary Conditions in the 12km domain
Summary • Using global model as boundary conditions for regional models is an efficient way to introduce external forcing and improve regional prediction. The regional model’s performance somehow depends on the predicting quality of global models that could differ significantly. • The model’s sensitivity to boundary conditions depends on model resolution, domain scale & locations, and relative strength of the inner pollutant emissions and reactions compared to external forcing. The 12km simulation covering Northeastern USA shows stronger sensitivity to lateral boundary conditions than the 60km simulation in altitudes < 5km. • Both 12km and 60km simulations show relatively high sensitivity in high altitudes, especially for O3, as it has strong stratospheric sources.