Download
1 / 20
200 likes | 216 Views
This study, led by Matthew Oliver, Matthew Grossi, and Erick Geiger from the University of Delaware, aims to map the distribution of ocean water masses and provinces using Argo profile data. The researchers will analyze the data to identify dynamic ocean biogeographic provinces. The presentation will take place on Thursday at 12:15pm and will be given by Andrew Irwin from Mt. Allison University, along with Matthew Oliver, Oscar Schofield, and Paul Falkowski from Rutgers University. The study also reflects on the European Pine Sawfly and prey density. The researchers plan to work on improving the parameterization of the curve and expanding the analysis to include temperature and salinity variations.

E N D
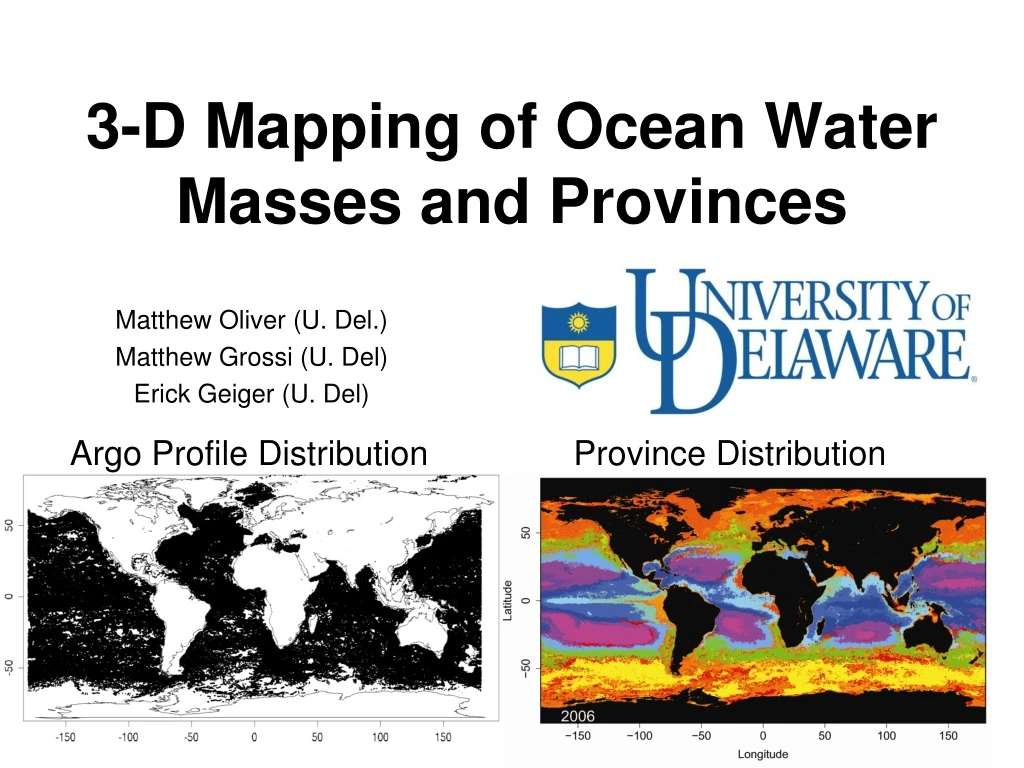
3-D Mapping of Ocean Water Masses and Provinces Argo Profile Distribution Province Distribution Matthew Oliver (U. Del.) Matthew Grossi (U. Del) Erick Geiger (U. Del)
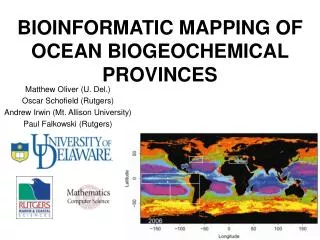
Mapping Dynamic Ocean Biogeographic Provinces Thursday 12:15pm Andrew Irwin (Mt. Allison University) Matthew Oliver (U. Del.) Oscar Schofield (Rutgers) Paul Falkowski (Rutgers)
Reflections on the European Pine Sawfly Holling, C.S. 1959. The components of predation as revealed by a study of small mammal predation of the European pine sawfly. Canad. Entomol. 91: 293-320.Holling, C.S. 1959. Some characteristics of simple types of predation and parasitism. Canad. Entomol. 91: 385-398. Prey switching curve
Reflections on the European Pine Sawfly Holling, C.S. 1959. The components of predation as revealed by a study of small mammal predation of the European pine sawfly. Canad. Entomol. 91: 293-320.Holling, C.S. 1959. Some characteristics of simple types of predation and parasitism. Canad. Entomol. 91: 385-398. No. of Prey Killed by One Predator A=10 A/2 No. of Prey Killed by One Predator B=15 Prey Density
Reflections on the European Pine Sawfly No. of Prey Killed by One Predator B=15 A/2 A=10 No. of Prey Killed by One Predator Prey Density
Modified Holling III Curve All Models are wrong, some are useful – G. Box A=0.08 B=143 C=1027 D=0.005 E=15.7 E A=4.1 B=147 C=1022 D=0.005 E=11.3 D A=7.3 B=137 C=1021 D=0.004 E=1.04 C
Argo Analysis ARGO DATA ASSESSMENT USING QUALITY CONTROL (QC) FLAGS No. of profiles Remaining Downloaded 500253 Missing variables 2000 498253 Failed QC 82962 415291 Profile <10 m 920 414371 Total analyzed: 414371
Future Work Work on minimizing the number of parameters to fit a curve Moving analysis beyond density and into temperature and salinity Moving analysis into coastal ocean Matching with Water Masses and Biomes