Download
1 / 5
50 likes | 218 Views
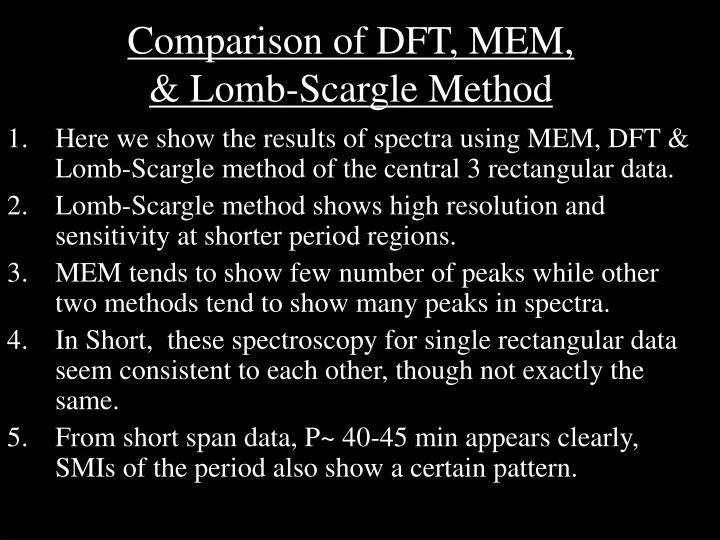
Comparison of DFT, MEM, & Lomb-Scargle Method. Here we show the results of spectra using MEM, DFT & Lomb-Scargle method of the central 3 rectangular data. Lomb-Scargle method shows high resolution and sensitivity at shorter period regions.

E N D
Comparison of DFT, MEM, & Lomb-Scargle Method • Here we show the results of spectra using MEM, DFT & Lomb-Scargle method of the central 3 rectangular data. • Lomb-Scargle method shows high resolution and sensitivity at shorter period regions. • MEM tends to show few number of peaks while other two methods tend to show many peaks in spectra. • In Short, these spectroscopy for single rectangular data seem consistent to each other, though not exactly the same. • From short span data, P~ 40-45 min appears clearly, SMIs of the period also show a certain pattern.
All Time (duration=420min) Y scale normalized with each maximum 0.1 mas-east Center 0.1 mas-west 420min White:MEM Blue: DFT Purple: Lomb-Scargle
Short Time (duration=195min) Y scale normalized with each maximum 0.1 mas-east Center 0.1 mas-west 40min 195min White:MEM Blue: DFT Purple: Lomb-Scargle Basically speaking, there are peak –correspondences. P~40-45min appears strongly from the short span data.
Peak positions in every spectroscopy Whole Time (420min)
Peak positions in every spectroscopy Short Time (195min)