Download
1 / 9
90 likes | 105 Views
9.1 Correlation. Key Concepts: Scatter Plots Correlation Sample Correlation Coefficient, r Hypothesis Testing for the Population Correlation Coefficient, ρ. 9.1 Correlation. What exactly do we mean by correlation?

E N D
9.1 Correlation • Key Concepts: • Scatter Plots • Correlation • Sample Correlation Coefficient, r • Hypothesis Testing for the Population Correlation Coefficient, ρ
9.1 Correlation • What exactly do we mean by correlation? • If two variables are correlated, it means a relationship exists between them. • Examples of correlated variables: • Job Satisfaction and Job Attendance • Number of Cows per Square Mile and Crime Rate • Height and Weight • High School GPA and College GPA • Square Footage and Price (of a house)
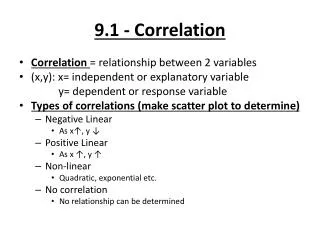
9.1 Correlation • Two questions we need to answer: • Does a linear (or straight line) correlation exist between the two variables? • If the variables appear linearly correlated, how strong is the correlation? • We can answer (1) using a scatter plot • The independent (explanatory) variable is x • The dependent (response) variable is y • Example: How well does High School GPA, x, “explain” College GPA, y? • See section 2.2 for a review of scatter plots
9.1 Correlation • Once the scatter plot is complete, we should be able to see if a linear relationship exists between the two variables. • See p. 470 for what we mean by Negative Linear Correlation, Positive Linear Correlation, No Correlation, and Nonlinear Correlation. • Next, we need a way to quantify or measure the strength of the linear relationship between the two variables.
9.1 Correlation • The Correlation Coefficientmeasures the strength and the direction of the linear relationship between two variables. The sample correlation coefficient, r, is defined as: where n is the number of pairs of data
9.1 Correlation • Things we need to know about the sample correlation coefficient, r : • r will always lie between -1 and 1, inclusive: -1 ≤ r ≤ 1 • If r = -1, we say there is a perfect negative linear correlation between the two variables. • If r = 1, there is a perfect positive linear correlation between the two variables. • The strength of the linear relationship between the variables is determined by r ’s proximity to 1 or -1. In other words, the closer r is to 1 or -1, the stronger the linear relationship. The closer r is to 0, the weaker the linear relationship. • Practice: #22 p. 482 (Age and Vocabulary)
9.1 Correlation • Once we have the sample linear correlation coefficient, r, we can use it in a t-Test to make an inference about the population linear correlation coefficient, ρ(Greek letter “rho”). • Why bother? • Remember we found r using a limited set of data. What about the rest of the population? Do we have enough evidence from the sample data to claim that a significant linear correlation exists between our two variables? • Example: If we have analyzed the High School GPA and College GPA of 25 students, is there enough evidence to claim that a significant linear correlation exists between the High School GPA and College GPA of all students?
9.1 Correlation • t-Test for the Population Correlation Coefficient • We will use the two-tailed version of this test: H0: ρ = 0 (no significant correlation exists) Ha: ρ ≠ 0 (a significant correlation exists) • The test statistic is r and the standardized test statistic is given by: Note: t follows a t-distribution with n – 2 degrees of freedom
9.1 Correlation • Practice using the t-Test: #32 p. 484 (Braking Distances: Wet Surface)