Download
1 / 31
310 likes | 442 Views
Basic of Statistics & Normal Distribution. What Is Statistics?. Collection of Data Survey Interviews. Summarization and Presentation of Data Frequency Distribution Measures of Central Tendency and Dispersion Charts, Tables,Graphs. Statistical Methods.

E N D
Basic of Statistics & Normal Distribution
What Is Statistics? • Collection of Data • Survey • Interviews • Summarization and Presentation of Data • Frequency Distribution • Measures of Central Tendency and Dispersion • Charts, Tables,Graphs
Statistical Methods Statistical Methods Descriptive Inferential Statistics Statistics
Key Terms • 1. Population (Universe) • All Items of Interest • 2. Sample • Portion of Population • 3. Parameter • Summary Measure about Population • 4. Statistic • Summary Measure about Sample • P in Population & Parameter • S in Sample & Statistic
StatisticalComputer Packages • 1. Typical Software • SAS • SPSS • MINITAB • Excel • 2. Need Statistical Understanding • Assumptions • Limitations
Standard Notation Measure Sample Population Mean ` m X Stand. Dev. S s 2 2 Variance S s Size n N
Mean • Measure of Central Tendency • Most Common Measure • Acts as ‘Balance Point’ • Affected by Extreme Values (‘Outliers’) • Formula (Sample Mean) n å X i X + X + L + X 1 2 n i = 1 X = = n n
Advantages of the Mean • Most widely used • Every item taken into account • Determined algebraically and amenable to algebraic operations • Can be calculated on any set of numerical data (interval and ratio scale) -Always exists • Unique • Relatively reliable
Disadvantages of the Mean • Affected by outliers • Cannot use in open-ended classes of a frequency distribution
n + 1 Positioning g Point = 2 Median • Measure of Central Tendency • Middle Value In Ordered Sequence • If Odd n, Middle Value of Sequence • If Even n, Average of 2 Middle Values • Not Affected by Extreme Values • Position of Median in Sequence
Advantages of the Median • Unique • Unaffected by outliers and skewness • Easily understood • Can be computed for open-ended classes of a frequency distribution • Always exists on ungrouped data • Can be computed on ratio, interval and ordinal scales
Disadvantages of Median • Requires an ordered array • No arithmetic properties
Mode • Measure of Central Tendency • Value That Occurs Most Often • Not Affected by Extreme Values • May Be No Mode or Several Modes • May Be Used for Numerical & Categorical Data
Advantages of Mode • Easily understood • Not affected by outliers • Useful with qualitative problems • May indicate a bimodal distribution
Disadvantages of Mode • May not exist • Not unique • No arithmetic properties • Least accurate
Relationship among Mean, Median, &Mode • If a distribution is symmetrical, the mean, median and mode coincide • If a distribution is non symmetrical, and skewed to the left or to the right, the three measures differ. A negatively skewed distribution (“skewed to the left”) A positively skewed distribution (“skewed to the right”) Mode Mean Mean Mode Median Median
Range = X - X l arg est smallest Range • Measure of Dispersion • Difference Between Largest & Smallest Observations
“VARIATION” The Root Of All Process EVIL
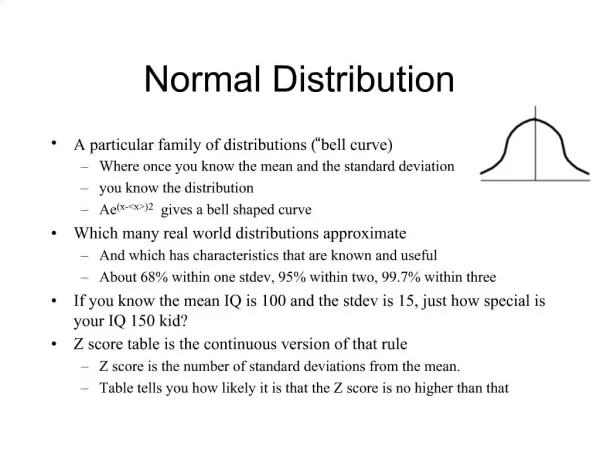
What is the standard deviation? • The SD says how far away numbers on a list are from their average. • Most entries on the list will be somewhere around one SD away from the average. Very few will be more than two or three SD’s away.
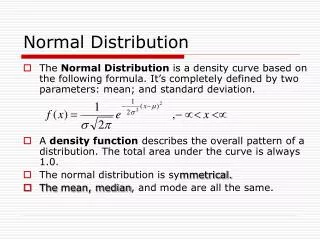
Variance & Standard Deviation • Measures of Dispersion • Most Common Measures • Consider How Data Are Distributed • Show Variation About Mean (`X or m)
What is the standard deviation • Same means different standard deviations SD S D
Sample Standard Deviation Formula(Computational Version) s =
S CV = × 100% X Coefficient of Variation • 1. Measure of Relative Dispersion • 2. Always a % • 3. Shows Variation Relative to Mean • 4. Used to Compare 2 or More Groups • 5. Formula (Sample)
Coefficient of Variation • 1. Measure of relative dispersion • 2. Always a % • 3. Shows variation relative to mean • 4. Used to compare 2 or more groups • 5. Formula: • 6. Population Sample s CV (100) CV (100) _ x
_ x _ x _ x Summary of Variation Measures Measure Equation Description x - x Total Spread Range largest smallest Q - Q Spread of Middle 50% Interquartile Range 3 1 Dispersion about 2 Standard Deviation x Sample Mean (Sample) n 1 Dispersion about Standard Deviation 2 x Population Mean (Population) N 2 Squared Dispersion Variance ( x ) about Sample Mean (Sample) n 1 Relative Variation Coeff. of Variation s / (100)