Download
1 / 54
540 likes | 566 Views
Uncover the fundamentals of Physical Geography through exploration of maps and theories. Understand map components, projections, and the significance of theories in the field. Delve into map distortions, types, and the impact of biased information. Discover the essence of theories and their evolution with changing evidence. Dive into the realm of geospatial perspectives and the significance of geographical knowledge within the AP Curriculum.

E N D
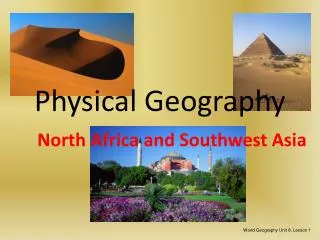
Catch Up Unit 1: Physical Geography “The Roma & Mitchell Show”
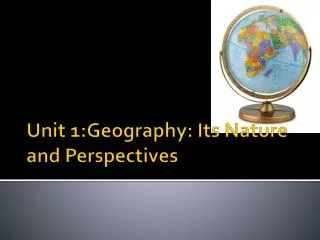
What is Geography? • 2 Main Branches • Human Geography • Physical Geography “The Spatial Perspective” • Why is Geography Important? • Environmental Determinism • Possibilism • Ethnocentrism
AP Curriculum • Models • Relevant Information • Current Events/Issues • Parallel/Summer Readings
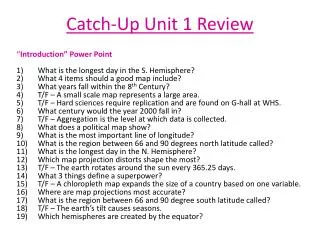
Basic Knowledge: Maps • Maps = Geographers tools • Basic Terms • Axis – Earth moves 1000 mph • Rotation = 23 hours, 56 min., 4.09 sec. WHY???? Several Theories… what aretheories? • Revolution = 365.25 days • Leap Year makes up for the inaccuracies in our day/year • Hemisphere • Hemi • Sphere • How many? What are continents? https://www.youtube.com/watch?v=3uBcq1x7P34
Maps cont. • Latitudinal Lines/Parallels • Most important line? • Which hemispheres? • How many degrees? • How many minutes? • 231/2 degrees N? 231/2 degrees S? • 662/3 degrees N? 662/3 degrees S? (It’s cold) • High latitude vs. Low Latitude? (Middle Latitude) • Longitudinal Lines/Meridians • Most important line? • Which hemispheres does it create? • How many total degrees? • How many minutes? • Where and what is the 180th meridian? (Hint: It has to do with something this guy never has)
Maps cont. • Map components • Title – what purpose? • Compass Rose: Cardinal and intermediate • (depends on the projection) • N, S, E, W • NE, SE, SW, NW • NNE, ENE, … • Legend/Key • Scale – Fraction vs. Graphic scales • The ratio of map units to real units • Global, national, regional, local • Large scale vs. Small scale? • www.ifitweremyhome.comwww.howbigreally.com How big would your house look on the map????
How Are Maps Like Men? • They all LIE!!! • All are distorted – most accurate in center • Different Lies… 1. Map Projections • Mercator projection • Robinson projection • Azimuthal or polar projection • Dymaxion projection • Equal Area projectionhttps://www.youtube.com/watch?v=vVX-PrBRtTY 2. Shortest distance b/t 2 points? • Great-circle route
These mushroom spores are too small to see, so we put them under a MICROSCOPE. When we can see them, we can study them.
This planet is too big to see, so we put it under a MACROSCOPE. When we can see it, we can study it.
“Some things are very tiny, and we must use complex electric and optical means (e.g., a microscope) to enlarge them so as to understand their configuration and structural relationships. In contrast, geographical things are so extensive that we must somehow reduce them to bring them into view.” - Arthur Robinson, cartographer
More Lies – Electoral Maps Aggregation aggregation can obscure regional disparities within certain territories and doesn’t usually include population density among other measures. Who won the 2000 & 2008 election according to the map? How close was the election? 4. Maps created by BIASED people = BIASED information!! Manipulation!!
Types of Maps • Physical • Political • Choropleth • Topographic • Dot (density) • Cartograms – my personal favorite • http://apcentral.collegeboard.com/apc/public/repository/ap09_frq_human_geography.pdf
Legend or Key Title Scale Compass Rose
Small Scale Map • Covers a LARGE area because 1 bar = 1000 miles!!
Large Scale Map • Covers a SMALL area because 1 bar is 1000 feet
Mercator • Good with direction • Bad with sizes and shapes
Robinson Projection • Compromise b/t size and shape • More accurate overall representation • Golden map for most geographers
Azimuthal/Polar Projection • Shows true direction and shape • Distorts size
Equal Area Projection • Excellent with size/shape • Bad w/ direction & distance • Ugly! Splits in map = “interruptions”
CONSIDER THE MAP The 2008 electoral vote. http://www-personal.umich.edu/~mejn/election/2008/
CONSIDER THE MAP The 2008 electoral vote by county.
Theories • What is a theory? • A story that TRIES to explain the facts • Versions of theories • Medicine – diagnosis • Science - hypothesis • Lawyers – argument/motive • Geography – MODELS • Hard vs. Soft sciences • Our 1st Theory… • Why do theories change? • New evidence contradicts • A theory more concisely explains the information
This map shows the total number of African-Americans per state. Examine Georgia.
In the previous slide, Georgia had one of the highest number of African-Americans, but a closer look tells a different picture. The dark red is the Atlanta metropolitan area.
Using Census Tracts of the Atlanta Metropolitan Area, a different scale gives different results.