Download
1 / 19
190 likes | 346 Views
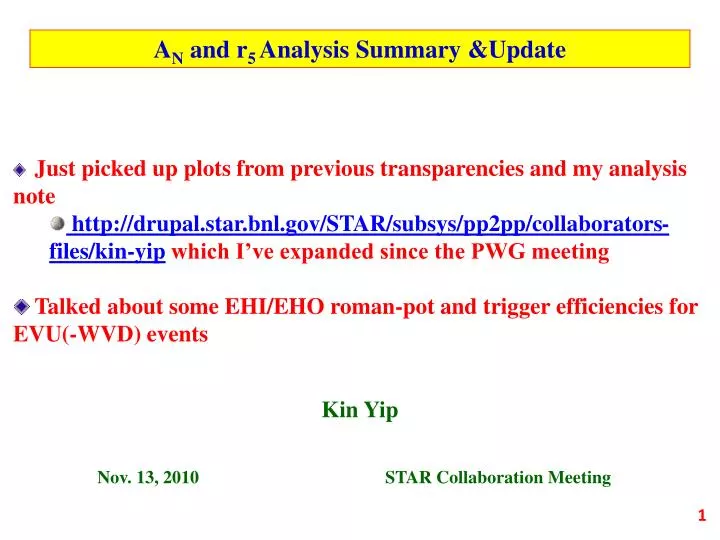
A N and r 5 Analysis Summary &Update. Just picked up plots from previous transparencies and my analysis note http://drupal.star.bnl.gov/STAR/subsys/pp2pp/collaborators-files/kin-yip which I’ve expanded since the PWG meeting

E N D
AN and r5 Analysis Summary &Update • Just picked up plots from previous transparencies and my analysis note • http://drupal.star.bnl.gov/STAR/subsys/pp2pp/collaborators-files/kin-yip which I’ve expanded since the PWG meeting • Talked about some EHI/EHO roman-pot and trigger efficiencies for EVU(-WVD) events Kin Yip Nov. 13, 2010 STAR Collaboration Meeting
Selection cuts : • Elastically Triggered (according to the online definitions); • valid hit/strip are those with ADC at 5 above the pedestal-per-channel; • Cluster with ≤5 valid consecutive hits with a sum of ADC’s higher than a certain threshold based on the number of strip in the cluster as detailed in Tomek’s note. • W hen the clusters in each RP satisfy the above criteria, I call it a “track”. At least one of the following track pairs : EHI-WHO or EHO-WHI or EVU-WVD or EVD-WVU needs to satisfy the following requirements: • In forming track, at least 1 cluster in A/C or B/D planes in each RP is required; • When there are >1 cluster in 1 plane, use the closest one; • Obvious if there is only 1 cluster in plane and none on the other plane; • If more than 1 cluster in one plane and none on the other plane, this track is vetoed. • The difference in the (same) coordinates for the A/C pair and B/D pair need to be 200 m.
Selection cuts (cont.): • Collinearity: For each run, we histogram x=[x(West) x(East)] and y=[y(West)- y(East)] which are generally centered at 0 and fit the histogram with a Gaussian to find the rms’ (x and y). The East-West track pair is kept when [(x/x)2(y/y)2] 32. • TAC cut: We also make histogram [TAC(East) – TAC(West)], the TAC difference for each East-West pairs and require that each event are within 3 ’s. • We have also made fiducial cuts to get rid of the outliers which may be background events. • To get rid of the “hot” regions, in the middle of the vertical RP’s nearest to the beam center, which has considerably more events than other parts of the same RP, we have rejected the events which fall into these “hot” regions with 3 ’s. These events lie near the ~90. For each run, we determine the extremes of the vertical coordinates of the hotspot manually and do a Gaussian fit to determine its in the horizontal direction which helps define the hotspot.
An example of finding hotspot range: The red curve shows the Gaussian fits done by automatic programming and the blue lines are the 3 ’s boundaries around the hotspot in WVU for the last run 10185023.
Combining all runs and all –t bins : (Left) Raw asymmetry divided by (Pb+Py) of each store; (Right) False asymmetry.
Individual –t bins : Figure 7: Raw asymmetries divided by (Pb+Py) of each store for 5 different –t bins are shown.
Fitted raw asymmetry divided by (PB+PY) with ANcos() as in the note --- will easily add the 2 runs
Contour plot of the fitted results of r5 (as in the previous fit)
The red curve is the curve of AN’sif we use polpol and the pink curve is the curve of of AN’sif we use polpol.
…. future variation: • 47 runs (including a short run without any candidates and 2 new runs which were only recently processed due to its lack of TPC info.) • Not all plots include the last 2 runs (but there should be no real difference) … • I have used alignment info. up to Donika’s resurvey … without any micro-alignment …. • When that’s finalized, I can put in the “correction” and redo everything again.
Efficiencies (suggested by JH) : • In each EVU(-WVD) event (satisfying all the cuts) for a run (10183028), in the overlapped regions (EVU overlapping with EHI and EVU overlapping with EHO), I check whether there is a track (which only satisfy some basic requirements such as cluster_length<5 and Energy>Emin_cut) in EHI or EHO in the respective overlapped region. • Inefficiencies: • EHI: (0.30 0.028) % EHO: (0.15 0.017)% • Very efficient !!
Trigger efficiencies: • Similarly, in the same EVU(-WVD) event and in the overlapped regions, I check whether whether EHI or EHO is fired in the respective overlapped region. • Note that the (online) trigger conditions are : • EHX1/2: 100 TAC 1700 and ADC 5 and • EHX = EHX1 or EHX2 • where X = I or O • Inefficiencies: • EHI: (2.86 0.08)% EHO: (3.79 0.08)%
ADC’s and TAC’s for EVU-WVD in the overlapped (EVU-EHI and EVU-EHO) region run 10183028 : • Plot the average if both pass thresholds; • Plot the one that passes the threshold; • if bad -ve (underflow)