Download

1 / 16
160 likes | 174 Views
Discover Washington's efforts to monitor and raise awareness about radon levels, utilizing geology insights and test results. Explore interactive maps, charts, and data visualizations revealing elevated radon risks. Learn about the EPA's Radon Risk Map and access national data through the EPA Exchange Network.

E N D
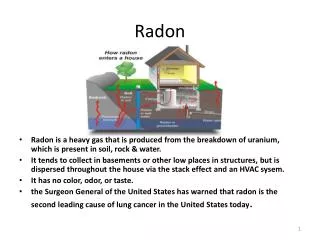
State of Radon • Regulations to monitor radon levels in homes exists in limited jurisdictions. • Limited focus in Healthy Homes programs • Investigated geology and existing test results to raise awareness
Washington Tracking Network (WTN) Radon Communications • Communications/Outreach • News release • More than 10 media outlets reported on the topic • Included one, two-minute spot on the evening news • Tweets • Facebook posts • Posted map to agency home page • Newsletter to internal staff • Maps to Local Health Jurisdictions www.wtn.doh.wa.gov
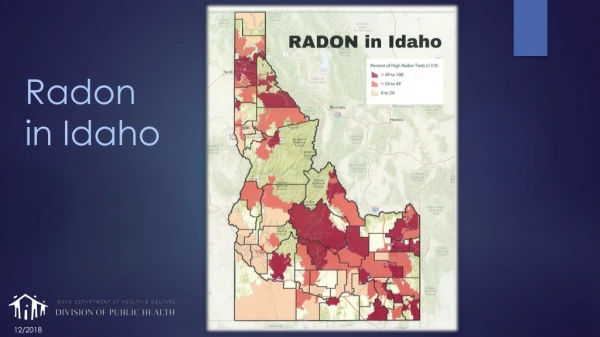
EPA Radon Risk Map: Probability Mapping of High (red >4pCiu/L) Medium (orange 2-<4 pCi/L) or Low (yellow <2 pCi/L) https://www.epa.gov/radon/find-information-about-local-radon-zones-and-state-contact-information#radonmap
Geology of Washington State1 HOWEVER… Washington Geological Survey, Interactive Map -- https://fortress.wa.gov/dnr/geology/?Theme=wigm
Geology of Washington State2 https://test-fortress.wa.gov/doh/wtn/WTNPortal/#!q0=450
The Approach Question: Where have elevated levels of radon in air been measured in buildings? Approach: Map Geological Risk and Documented Elevated Test Results Technique: Obtain all test results, retain the highest test result per address Results: High results were found throughout WA regardless of the Geological Risk. Details: More high test results corresponded to Medium and High risk geologies Message: TEST FIX SAVE A LIFE
The Presentation View the data with: Tables Sortable and downloadable Show the data that are displayed in Charts and Maps Information on Number of Tests, Number and Percentages at 0-2, 2-4 and 4+ pCi/L Information by different geographical units (state, county, census tract) Charts Time series for numbers over time (1989-2015) Bar graphs for county of census tracts Maps Choropleth maps Pop-ups with data for the area of interest
Exchange Network • Availability of National Data • EPA data exchange network (share data with EPA and • other Network Partners securely via the Internet) • 3. Radon data availability (Lead by NJ) • 4. Three ways to expose/access data via EN • 1- Node on your local server • 2- Virtual node- cloud based • 3- Service Center - ?
Exchange Network Service Center- A tool for making manual data submissions to EPA. Exchange Network Service Center (Send, retrieve, and download information from other partners on the network. ) Data presented in a standard format (manual file submission in any format, including common formats such as XML, JSON, and CSV.
Contact and Explore • Tina.echeverria@doh.wa.gov • Tracking Network: www.doh.wa.gov/wtn