Download
1 / 8
210 likes | 808 Views
Mean Variance Standard Deviation. From: Mathisfun.com http://www.mathsisfun.com/data/standard-deviation.html. Standard Deviation is a measure of how spread out numbers are. The heights (at the shoulders) are: 600mm, 470mm, 170mm, 430mm and 300mm.

E N D
MeanVarianceStandard Deviation From: Mathisfun.com http://www.mathsisfun.com/data/standard-deviation.html
Standard Deviation is a measure of how spread out numbers are. The heights (at the shoulders) are: 600mm, 470mm, 170mm, 430mm and 300mm. Find out the Mean, the Variance, and the Standard Deviation. http://www.mathsisfun.com/data/standard-deviation.html
Find MEAN So Mean (average) height is 394 mm http://www.mathsisfun.com/data/standard-deviation.html
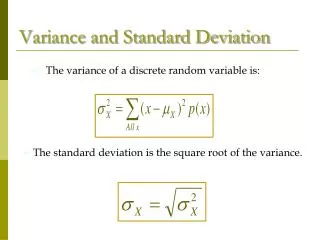
VARIANCE (σ2) = each dog’s difference from the Mean= average of the squared differences from the Mean To calculate VARIANCE, take each difference, square it, and then average the result http://www.mathsisfun.com/data/standard-deviation.html
STANDARD DEVIATION(σ ) Standard Deviation= square root of Variance σ = √21,704 = 147.32... = 147mm Standard Deviation is useful. Now we can show which heights are within one Standard Deviation (147mm) of the Mean: Rottweilersare tall dogs and Dachshunds are a bit short http://www.mathsisfun.com/data/standard-deviation.html
SAMPLE Our example was for a Population(the 5 dogs were the only dogs we were interested in) But if the data is a Sample (a selection taken from a bigger Population), then the calculation changes When you have "N" data values that are: The Population: divide by N when calculating Variance (like we did) A Sample: divide by N-1 when calculating Variance All other calculations stay the same, including the mean. http://www.mathsisfun.com/data/standard-deviation.html
SAMPLE of Bigger Population http://www.mathsisfun.com/data/standard-deviation.html
POPULATION STANDARD DEVIATION • SAMPLE STANDARD DEVIATION http://www.mathsisfun.com/data/standard-deviation.html