Download
1 / 15
180 likes | 791 Views
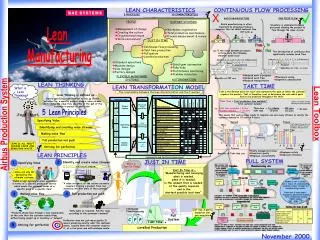
Lean Transportation TRANSPORTATION – Strategy 2004 Asset Management Transportation Assessment Fleet Analysis (as-is) Capacity Analysis Cost Per Mile Optimal Asset Analysis (to-be) Optimal Asset Requirements Breakeven Analysis Benchmarking Balance utilization with optimal performance

E N D
TRANSPORTATION – Strategy 2004 • Asset Management • Transportation Assessment • Fleet Analysis (as-is) • Capacity Analysis • Cost Per Mile • Optimal Asset Analysis (to-be) • Optimal Asset Requirements • Breakeven Analysis • Benchmarking • Balance utilization with optimal performance • Solution and recommendation • Savings • Software Development • Routing & Cubing Software • Lit Survey for Algorithms • Web based framework • Software Development • Documentation • Simulation • Implementation
TRANSPORTATION – Fleet Analysis 2003 Cost Per Mile
TRANSPORTATION – Fleet Analysis Results • Rightsizing the fleet • Reduced the fleet size by 17 pieces of equipment (4 tractors, 5 straight trucks, and 8 trailers) by the end of the year. • Repositioning of equipment for effective utilization • Repositioned 5 pieces of equipment and 10 additional pieces of equipment (5 tractor and 5 straight trucks) are under review for repositioning by the end of the year.
TRANSPORTATION – Routing • Routing - Finding an optimal delivery routefor each truck to make the best and most efficient use of the vehicle assets • Current Status • Developed a web based application (Route+) • Order assignment to trucks can be done by dispatcher manually or auto-allocation • Routing sequence is performed by routing heuristic • Constraints considered: • Weight • Time window • Waiting time • Max truck hours • To be implemented in all branches
TRANSPORTATION – Cubing • Cubing - To determine the optimal arrangement of products in a given truck • Current Status • A rough-cut solution which recommends a cubing layout for four major items • Pipes, gates, chain links, wood • Data available for 40% of SKUs • Pipes – 60%, Gates – 53%, Chain links – 29%, Wood – 28%
TRANSPORTATION – Routing & Cubing Application Results • Fleet utilization - implying - reduction in External Transpotation usage • Reduced delivery cost per order by reducing miles and increasing volume utilization • Reduction in outside part-time labor and driver overtime • High visibility over cost and capacity parameters • Greater control on fleet management
TRANSPORTATION – Routing & Cubing Application • Benefits • Decreased Activity Level at Branches for Scheduling Purposes • Estimate: ½ Man Year Per Branch • Increased Customer Service or Decreased Inventory Needs Due to Proper Loading • Decreased Transportation Costs • Estimated Savings - $1 Million Annually
Improve fleet utilization Cubing / Weight / Routing / Hours of Use Effectively manage a reduced carrier base Niche and regional carriers Gain control of inbound materials Provide information to make better decisions Reduce overall costs to move product & effectively utilize inventory Logistics Direction