Download
1 / 42
420 likes | 754 Views
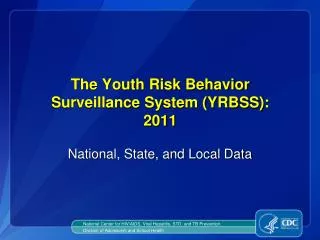
The Youth Risk Behavior Surveillance System (YRBSS): 2009 National, State, and Local Data 2009 YRBS Results Physical Activity Percentage of High School Students Who Were Physically Active at Least 60 Minutes/Day on All 7 Days,* by Sex † and Race/Ethnicity, ‡ 2009

E N D
The Youth Risk Behavior Surveillance System (YRBSS):2009 National, State, and Local Data
Percentage of High School Students Who Were Physically Active at Least 60 Minutes/Day on All 7 Days,* by Sex† and Race/Ethnicity,‡ 2009 * Were physically active doing any kind of physical activity that increased their heart rate and made them breathe hard some of the time for a total of at least 60 minutes/day on all 7 days during the 7 days before the survey. † M > F ‡W > B, H National Youth Risk Behavior Survey, 2009
Percentage of High School Students Who Were Physically Active at Least 60 Minutes/Day on All 7 Days,* 2005 – 2009† * Were physically active doing any kind of physical activity that increased their heart rate and made them breathe hard some of the time for a total of at least 60 minutes/day on all 7 days during the 7 days before the survey. † No change 2005–2009, p < 0.05. National Youth Risk Behavior Surveys, 2005-2009
Range and Median Percentage of High School Students Who Were Physically Active at Least 60 Minutes/Day on All 7 Days,* Across 42 States and 20 Cities, 2009 * Were physically active doing any kind of physical activity that increased their heart rate and made them breathe hard some of the time for a total of at least 60 minutes/day on all 7 days during the 7 days before the survey. State and Local Youth Risk Behavior Surveys, 2009
Percentage of High School Students Who Were Physically Active at Least 60 Minutes/Day on All 7 Days,* 2009 17.0% - 21.3% 21.4% - 23.7% 23.8% - 25.2% 25.3% - 27.8% No Data * Were physically active doing any kind of physical activity that increased their heart rate and made them breathe hard some of the time for a total of at least 60 minutes/day on all 7 days during the 7 days before the survey. State Youth Risk Behavior Surveys, 2009
Percentage of High School Students Who Were Physically Active at Least 60 Minutes/Day on All 7 Days,* 2009 Seattle Boston Milwaukee New York City Detroit Philadelphia Chicago San Francisco 14.8% - 16.9% Clark County 17.0% - 18.5% Memphis 18.6% - 21.8% Los Angeles San Bernardino Charlotte- Mecklenburg County 21.9% - 26.3% San Diego No Data Dallas Duval County Orange County Palm Beach County Broward County Miami-Dade County * Were physically active doing any kind of physical activity that increased their heart rate and made them breathe hard some of the time for a total of at least 60 minutes/day on all 7 days during the 7 days before the survey. Local Youth Risk Behavior Surveys, 2009
Percentage of High School Students Who Were Physically Active at Least 60 Minutes/Day on 5 or More Days,* by Sex† and Race/Ethnicity,‡ 2009 * Were physically active doing any kind of physical activity that increased their heart rate and made them breathe hard some of the time for a total of at least 60 minutes/day on 5 or more days during the 7 days before the survey. † M > F ‡W > B, H National Youth Risk Behavior Survey, 2009
Percentage of High School Students Who Were Physically Active at Least 60 Minutes/Day on 5 or More Days,* 2005 – 2009† * Were physically active doing any kind of physical activity that increased their heart rate and made them breathe hard some of the time for a total of at least 60 minutes/day on 5 or more days during the 7 days before the survey. † No change 2005–2009, p < 0.05. National Youth Risk Behavior Surveys, 2005–2009
Range and Median Percentage of High School Students Who Were Physically Active at Least 60 Minutes/Day on 5 or More Days,* Across 42 States and 20 Cities, 2009 * Were physically active doing any kind of physical activity that increased their heart rate and made them breathe hard some of the time for a total of at least 60 minutes/day on 5 or more days during the 7 days before the survey. State and Local Youth Risk Behavior Surveys, 2009
Percentage of High School Students Who Were Physically Active at Least 60 Minutes/Day on 5 or More Days,* 2009 33.3% - 40.3% 40.4% - 44.0% 44.1% - 46.6% 46.7% - 53.6% No Data * Were physically active doing any kind of physical activity that increased their heart rate and made them breathe hard some of the time for a total of at least 60 minutes/day on 5 or more days during the 7 days before the survey. State Youth Risk Behavior Surveys, 2009
Percentage of High School Students Who Were Physically Active at Least 60 Minutes/Day on 5 or More Days,* 2009 Seattle Boston Milwaukee New York City Detroit Philadelphia Chicago San Francisco 25.9% - 31.1% Clark County 31.2% - 34.7% Memphis 34.8% - 39.7% Los Angeles San Bernardino Charlotte- Mecklenburg County 39.8% - 47.0% San Diego No Data Dallas Duval County Orange County Palm Beach County Broward County Miami-Dade County * Were physically active doing any kind of physical activity that increased their heart rate and made them breathe hard some of the time for a total of at least 60 minutes/day on 5 or more days during the 7 days before the survey. Local Youth Risk Behavior Surveys, 2009
Percentage of High School Students Who Did Not Participate in at Least 60 Minutes of Physical Activity on Any Day,* by Sex† and Race/Ethnicity,‡ 2009 * Did not participate in at least 60 minutes of any kind of physical activity that increased their heart rate and made them breathe hard some of the time on at least 1 day during the 7 days before the survey. † F > M ‡B > H > W National Youth Risk Behavior Survey, 2009
Percentage of High School Students Who Did Not Participate in at Least 60 Minutes of Physical Activity on Any Day,* 2005 – 2009† * Did not participate in at least 60 minutes of any kind of physical activity that increased their heart rate and made them breathe hard some of the time on at least 1 day during the 7 days before the survey. † No change 2005–2009, p < 0.05. National Youth Risk Behavior Surveys, 2005–2009
Range and Median Percentage of High School Students Who Did Not Participate in at Least 60 Minutes of Physical Activity on Any Day,* Across 42 States and 20 Cities, 2009 * Did not participate in 60 or more minutes of any kind of physical activity that increased their heart rate and made them breathe hard some of the time on at least 1 day during the 7 days before the survey. State and Local Youth Risk Behavior Surveys, 2009
Percentage of High School Students Who Did Not Participate in at Least 60 Minutes of Physical Activity on Any Day,* 2009 10.5% - 13.6% 13.7% - 16.0% 16.1% - 18.2% 18.3% - 23.3% No Data * Did not participate in at least 60 minutes of any kind of physical activity that increased their heart rate and made them breathe hard some of the time on at least 1 day during the 7 days before the survey. State Youth Risk Behavior Surveys, 2009
Percentage of High School Students Who Did Not Participate in at Least 60 Minutes of Physical Activity on Any Day,* 2009 Seattle Boston Milwaukee New York City Detroit Philadelphia Chicago San Francisco 14.7% - 17.7% Clark County 17.8% - 21.2% Memphis 21.3% - 23.5% Los Angeles San Bernardino Charlotte- Mecklenburg County 23.6% - 28.5% San Diego No Data Dallas Duval County Orange County Palm Beach County Broward County Miami-Dade County * Did not participate in at least 60 minutes of any kind of physical activity that increased their heart rate and made them breathe hard some of the time on at least 1 day during the 7 days before the survey. Local Youth Risk Behavior Surveys, 2009
Percentage of High School Students Who Played Video or Computer Games or Used a Computer for 3 or More Hours/Day,* by Sex† and Race/Ethnicity,‡ 2009 * For something that was not school work on an average school day. † M > F ‡B > H > W National Youth Risk Behavior Survey, 2009
Percentage of High School Students Who Played Video or Computer Games or Used a Computer for 3 or More Hours/Day,* 2003 – 2009† * For something that was not school work on an average school day. † Increased 2003–2009, p < 0.05. National Youth Risk Behavior Surveys, 2003–2009
Range and Median Percentage of High School Students Who Played Video or Computer Games or Used a Computer for 3 or More Hours/Day,* Across 41 States and 20 Cities, 2009 * For something that was not school work on an average school day. State and Local Youth Risk Behavior Surveys, 2009
Percentage of High School Students Who Played Video or Computer Games or Used a Computer for 3 or More Hours/Day,* 2009 12.1% - 20.9% 21.0% - 23.4% 23.5% - 26.1% 26.2% - 31.0% No Data * For something that was not school work on an average school day. State Youth Risk Behavior Surveys, 2009
Percentage of High School Students Who Played Video or Computer Games or Used a Computer for 3 or More Hours/Day,* 2009 Seattle Boston Milwaukee New York City Detroit Philadelphia Chicago San Francisco 24.2% - 27.6% Clark County 27.7% - 28.5% Memphis 28.6% - 33.1% Los Angeles San Bernardino Charlotte- Mecklenburg County 33.2% - 42.5% San Diego No Data Dallas Duval County Orange County Palm Beach County Broward County Miami-Dade County * For something that was not school work on an average school day. Local Youth Risk Behavior Surveys, 2009
Percentage of High School Students Who Watched 3 or More Hours/Day of Television,* by Sex and Race/Ethnicity,† 2009 * On an average school day. † B > H > W National Youth Risk Behavior Survey, 2009
Percentage of High School Students Who Watched 3 or More Hours/Day of Television,* 1999 – 2009† * On an average school day. † Decreased 1999–2009, p < 0.05. National Youth Risk Behavior Surveys, 1999–2009
Range and Median Percentage of High School Students Who Watched 3 or More Hours/Day of Television,* Across 41 States and 20 Cities, 2009 * On an average school day. State and Local Youth Risk Behavior Surveys, 2009
Percentage of High School Students Who Watched 3 or More Hours/Day of Television,* 2009 16.3% - 25.5% 25.6% - 30.7% 30.8% - 36.2% 36.3% - 44.9% No Data * On an average school day. State Youth Risk Behavior Surveys, 2009
Percentage of High School Students Who Watched 3 or More Hours/Day of Television,* 2009 Seattle Boston Milwaukee New York City Detroit Philadelphia Chicago San Francisco 27.7% - 39.6% Clark County 39.7% - 42.6% Memphis 42.7% - 44.6% Los Angeles San Bernardino Charlotte- Mecklenburg County 44.7% - 59.6% San Diego No Data Dallas Duval County Orange County Palm Beach County Broward County Miami-Dade County * On an average school day. Local Youth Risk Behavior Surveys, 2009
Percentage of High School Students Who Attended Physical Education Classes,* by Sex and Race/Ethnicity, 2009 * On 1 or more days in an average week when they were in school. National Youth Risk Behavior Survey, 2009
Percentage of High School Students Who Attended Physical Education Classes,* 1991 – 2009† * On 1 or more days in an average week when they were in school. † No change 1991–2009, p < 0.05. National Youth Risk Behavior Surveys, 1991–2009
Range and Median Percentage of High School Students Who Attended Physical Education Classes,* Across 36 States and 19 Cities, 2009 * On 1 or more days in an average week when they were in school. State and Local Youth Risk Behavior Surveys, 2009
Percentage of High School Students Who Attended Physical Education Classes,* 2009 29.1% - 39.3% 39.4% - 43.7% 43.8% - 52.8% 52.9% - 92.0% No Data * On 1 or more days in an average week when they were in school. State Youth Risk Behavior Surveys, 2009
Percentage of High School Students Who Attended Physical Education Classes,* 2009 Seattle Boston Milwaukee New York City Detroit Philadelphia Chicago San Francisco 35.5% - 42.9% Clark County 43.0% - 47.1% Memphis 47.2% - 55.5% Los Angeles San Bernardino Charlotte- Mecklenburg County 55.6% - 81.1% San Diego No Data Dallas Duval County Orange County Palm Beach County Broward County Miami-Dade County * On 1 or more days in an average week when they were in school. Local Youth Risk Behavior Surveys, 2009
Percentage of High School Students Who Attended Physical Education Classes Daily,* by Sex and Race/Ethnicity,† 2009 * 5 days in an average week when they were in school. † H > W National Youth Risk Behavior Survey, 2009
Percentage of High School Students Who Attended Physical Education Classes Daily,* 1991 – 2009† * 5 days in an average week when they were in school. † Decreased 1991–1995, no change 1995–2009, p < 0.05. National Youth Risk Behavior Surveys, 1991–2009
Range and Median Percentage of High School Students Who Attended Physical Education Classes Daily,* Across 36 States and 19 Cities, 2009 * 5 days in an average week when they were in school. State and Local Youth Risk Behavior Surveys, 2009
Percentage of High School Students Who Attended Physical Education Classes Daily,* 2009 5.4% - 20.0% 20.1% - 23.0% 23.1% - 30.9% 31.0% - 67.5% No Data * 5 days in an average week when they were in school. State Youth Risk Behavior Surveys, 2009
Percentage of High School Students Who Attended Physical Education Classes Daily,* 2009 Seattle Boston Milwaukee New York City Detroit Philadelphia Chicago San Francisco 8.4% - 20.1% Clark County 20.2% - 26.3% Memphis 26.4% - 37.7% Los Angeles San Bernardino Charlotte- Mecklenburg County 37.8% - 46.4% San Diego No Data Dallas Duval County Orange County Palm Beach County Broward County Miami-Dade County * 5 days in an average week when they were in school. Local Youth Risk Behavior Surveys, 2009
Percentage of High School Students Who Played on at Least One Sports Team,* by Sex† and Race/Ethnicity,‡ 2009 * Run by their school or community groups during the 12 months before the survey. † M > F ‡W, B > H National Youth Risk Behavior Survey, 2009
Percentage of High School Students Who Played on at Least One Sports Team,* 1999 – 2009† * Run by their school or community groups during the 12 months before the survey. † No change 1999–2009, p < 0.05. National Youth Risk Behavior Surveys, 1999–2009
Range and Median Percentage of High School Students Who Played on at Least One Sports Team,* Across 30 States and 16 Cities, 2009 * Run by their school or community groups during the 12 months before the survey. State and Local Youth Risk Behavior Surveys, 2009
Percentage of High School Students Who Played on at Least One Sports Team,* 2009 48.2% - 52.1% 52.2% - 57.4% 57.5% - 60.0% 60.1% - 64.4% No Data * Run by their school or community groups during the 12 months before the survey. State Youth Risk Behavior Surveys, 2009
Percentage of High School Students Who Played on at Least One Sports Team,* 2009 Seattle Boston Milwaukee New York City Detroit Philadelphia Chicago San Francisco 42.8% - 45.7% Clark County 45.8% - 49.7% Memphis 49.8% - 51.9% Los Angeles San Bernardino Charlotte- Mecklenburg County 52.0% - 56.8% San Diego No Data Dallas Duval County Orange County Palm Beach County Broward County Miami-Dade County * Run by their school or community groups during the 12 months before the survey. Local Youth Risk Behavior Surveys, 2009