Download
1 / 32
330 likes | 659 Views
COSMIC RAY MUON DETECTION USING SCINTILLATION COUNTER AND WAVELENGTH SHIFTING FIBERS. ARUNODAYA BHATTACHARYA VSRP-2009,TIFR,MUMBAI 6/7/09. Topics covered. Motivation Tools used Experimental setup Data collection Analysis of data Results Future Plans. Motivation.

E N D
COSMIC RAY MUON DETECTION USING SCINTILLATION COUNTERAND WAVELENGTH SHIFTING FIBERS ARUNODAYA BHATTACHARYA VSRP-2009,TIFR,MUMBAI 6/7/09
Topics covered • Motivation • Tools used • Experimental setup • Data collection • Analysis of data • Results • Future Plans
Motivation • Scintillator detectors are used for detecting muons in many High energy physics experiments like the CMS experiment. In this experiment they have a geometry of four wavelength shifting fibers in each scintillator tile for trigger generation. • But tiles are big, so difficult to localize muon event on the tile. • If we read each fiber independently then we may improve our trigger condition. • For this we need a reference for determining muon position on scintillator. • To independently determine the position of the muon, Resistive Plate Chambers (RPC) are used in the INO lab. • Photomultiplier tubes are used as read-outs for the optical fibers.
Muons • Fundamental charged particles-LEPTONS • One unit of charge • Produced by decay of pions • Mean life time=2.2μsec. • Mass is 210 times the mass of electron.
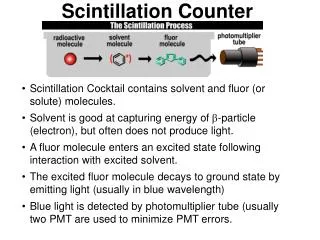
Construction of Paddle • Paddle=Scintillator+optical fibers+Photomultiplier tube • Organic (plastic) scintillator – polyvinyl toluene • Light is produced when charged particle passes through it • We use four wavelength shifting fibers embedded in the scintillator to transmit light to the Photomultiplier tube. • Wavelength shifting fibers are spliced with clear low attenuation optical fibers at the end of the tile to avoid signal loss. • Initially all four fibers are coupled to one PMT . • In the second stage of the experiment each fiber is read out separately to study light collected by single fiber. PMT 4 PMTs SCINTILLATOR 30cmx30cmx1cm SCINTILLATOR 30cmx30cmx1cm
Operating voltage of PMT and Noise Rate NIM 3-Fold SCALAR 3F 1 COINCIDENCE 24.5cm 2 22.5cm 23.5cm DISC. 4-Fold SCALAR MAIN PADDLE DELAY COINCIDENCE 4 SCALAR Dimensions: Pad.1=20cmx2cmx1cm Pad.2=20cmx5cmx1cm Pad.3=30cmx20cmx1cm Pad.4=30cmx20cmx1cm Vth= -30mV Efficiency=(4F/3F)X100 %
Independent measurement required to confirm “MUON” event RESISTIVE PLATE CHAMBERS • Gas filled detector with glass electrodes • Gas composition Freon=95.15% Isobutane=4.15% SF6=0.34% • Resistivity of glass=10^(12)cm • Width of pickup strips=2.8cm 1m 1m 10kV is applied between glass plates.! Charge particle produces an avalanche in the gas which induces signal on pick-up strips.
V-I Characteristic of RPC Equivalent circuit of RPC Operating voltage
Final Experimental setup GIVE THE STACK DIAGRAM!!! RPC is triggering our paddle!
Trigger Generation And Analysis of the Output RPC STACK 12 LAYERS COMPUTER CONSOLE A D C C A M A C B U S 8-Fold TRIGGER GATE ADC OUTPUT SCINT. PADDLE ANALOG PULSE INPUT DELAY RPC DATA COMPUTER CONSOLE X-Y POSITION OF MUON DATAACQUISITION SYSTEM PROCESSED DATA
Signal attenuation due to delay cables • Paddle pulse is delayed for coincidence with the RPC trigger • Gate width =53.4nsec. • Net delay imparted = 198nsec. • Percentage decrease in paddle pulse height=58% RPC TRIGGER PMT PULSE
Pedestal peak Muon signal distribution
Change over to Single Fiber Three out of four optical fibers are cut from the PMT cookie. Only one fiber is connected to PMT now. Paddle is aligned again on the RPC stack as done earlier. We want a synchronized run of the Data Acquisition System of RPC and ADC.
Pedestal peak No muon signal !!! We did not get any muon signal distribution with single fiber. This has happened due to the attenuation because of long cables!!!
Ch.2 • Since muon signal is very weak, we used “STORAGE OSCILLOSCOPE” • Initially we studied with four fibers. Paddle Pulse Ch.1 STORAGE OSCILLOSCOPE 8F RPC Signal Ch.2 TRIGGERS Ch.1 WE AVOIDED DELAYING PADDLE PULSE AND HENCE THE ATTENUATION
Major Problems to solve: Trigger rate from RPC is higher than the sampling rate of the storage oscilloscope. So, we can’t correlate the data corresponding to x-y position of muon and their pulse height. • We need to synchronize the Data Acquisition System of RPC and ADC or storage oscilloscope .This can be done by lowering the trigger rate from the RPC. • We need to somehow find a solution to avoid the attenuation of the paddle pulse.
Future work • Since signal attenuation is difficult to avoid, we will amplify the PMT signal by charge amplifiers and obtain good pulse height. • We will reduce the trigger rate from the RPC to achieve a correlation between the x-y position of the muon and the corresponding pulse height from the scintillator.
ACKNOWLEDGEMENT Prof.Sudeshna Banerjee B.S.Satyanarayana L.V.Reddy And all the lab members!
Pedestal distribution Muon signal distribution ADC Count plot Scintillator tile area We expected larger ADC count in the tile area!!!! Maybe there is a mismatch between DAQ system of RPC and ADC!!! y (mm) !Problem needs to be figured out! X- (mm)
Plateau curve and Noise Rate GEOMETRY ALIGNMENT 1 2 24.5cm 22.5cm 23.5cm MAIN PADDLE 4 Dimensions: Pad.1=20cmx2cmx1cm Pad.2=20cmx5cmx1cm Pad.3=30cmx20cmx1cm Pad.4=30cmx20cmx1cm 1650V
Plateau curve and Noise Rate GEOMETRY ALIGNMENT 1 2 24.5cm 22.5cm 23.5cm MAIN PADDLE 4 Dimensions: Pad.1=20cmx2cmx1cm Pad.2=20cmx5cmx1cm Pad.3=30cmx20cmx1cm Pad.4=30cmx20cmx1cm 1650V