Download
1 / 10
100 likes | 202 Views
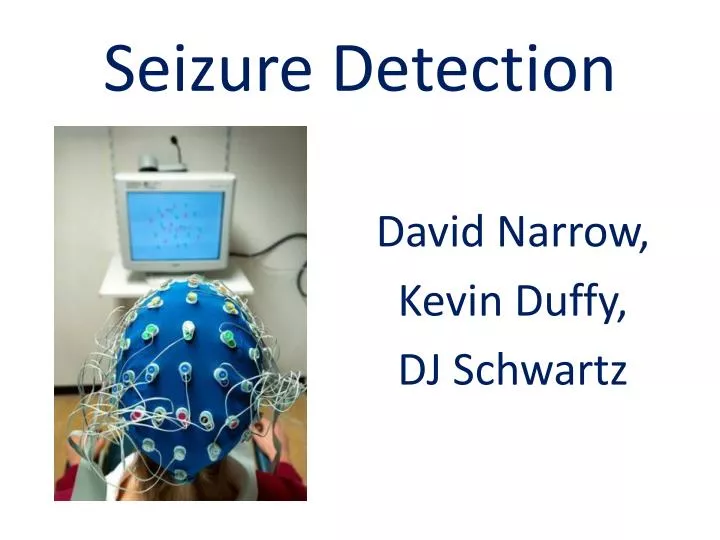
Seizure Detection. David Narrow, Kevin Duffy, DJ Schwartz. The EEG is a biomedical first developed by Hans Berger in the 1920’s (Cohen, 2009) During 30 to 60 minute test, 10 to 20 electrodes spaced around the scalp (Cohen, 2009)

E N D
Seizure Detection David Narrow, Kevin Duffy, DJ Schwartz
The EEG is a biomedical first developed by Hans Berger in the 1920’s (Cohen, 2009) During 30 to 60 minute test, 10 to 20 electrodes spaced around the scalp (Cohen, 2009) Scientists have discovered wave properties that represent seizures (frequency, relative amplitude) EEGs can show toxic or metabolic abnormalities and diseases such as Alzheimer’s (Bokde, 2009) EEG Background Information
Benefits • Seizure detection very useful • If we can learn how to detect a seizure than we can then find a way to stop the seizure • Epilepsy is not uncommon • Seizure prevention is crucial to prevent potential injuries and maybe deaths
True progression False progression Normal progression Inputs: Patient #, Sampling Frequency, Threshold If amp epoch /amp back >3 Load Patient Data (EEG) If 1/40< Mean dur epoch <1/6 t=1 No seizure End* t=t+1 While t < t final-30 If COV<0.36 Create half-waves for background and epoch SEIZURE detected at time t Find amp of background and epoch, Average amp duration in epoch, COV of epoch * Displays number of seizures, times where detected, plot of half-wave, and plot of EEG with seizures displayed as red stars
Results • 200 Hz Sampling Frequency • 0.25 Threshold • We detected seizures in patient number 9 and patient number 1 • Patient 9 gave us 14 seizures and patient 1 gave us 1 seizure • Our algorithm does detect Seizures
Future Efforts • To create an algorithm that will be able to detect all types of seizures without having any false detections or skipping any detections that are seizures • Add more user-defined inputs, more graphical images, relative seizure durations and severities etc.
Bibliography • Bokde, Arun M.L., Michael Ewers, and HaraldHampel. "Assessing neuronal networks: Understanding Alzheimer's disease." 26 June 2009. Science Direct. ISI Web of Science. 10 Nov. 2009 <http://www.sciencedirect.com>. • Cohen, Jerome. "Electroencphalography." 2009. Access Science. McGraw Hill. 10 Nov. 2009 <http://www.accessscience.com>. • Gotman, J. “Automatic Recognition of Epileptic Seizures in the EEG.” Electroncephalography and clinical Neurophysiology 54 (1982): 530-540. • Millett, David. "Hans Berger from psychic energy to EEG." 2001. ProQuest Research. ProQuest. 10 Nov. 2009 <http://www.proquest.com>.