Download
1 / 42
430 likes | 977 Views
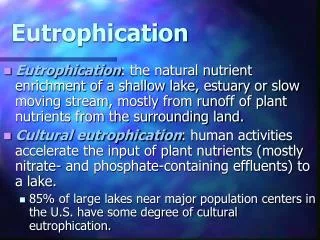
Eutrophication 2 Causes of Eutrophication. Alice Newton University of Algarve. Causes of Eutrophication. Biogeochemical Cycles and Nutrients Nitrogen cycle Atmospheric deposition Loss of Wetlands Animal wastes Fertilizer use and surplus. Causes of Eutrophication.

E N D
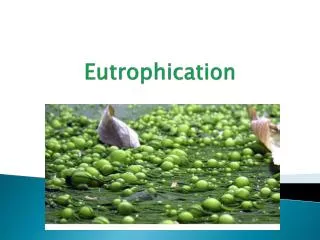
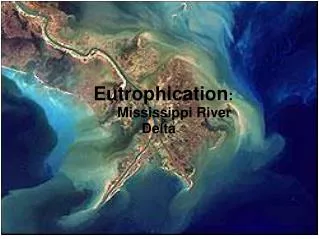
Eutrophication 2Causes of Eutrophication Alice Newton University of Algarve
Causes of Eutrophication Biogeochemical Cycles and Nutrients Nitrogen cycle Atmospheric deposition Loss of Wetlands Animal wastes Fertilizer use and surplus
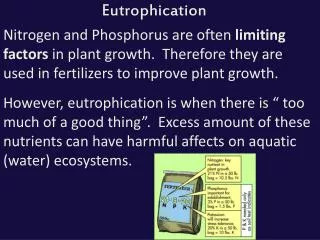
Causes of Eutrophication • Perturbation of N & P biogeochemical cycles • Synthetic Fertilizers • Burning of Fossil Fuels • Monoculture of Legumes • Animal Wastes and Manure • Sewage: Sewage treatment reduces BOD and some P inputs but no significant reduction of N • Loss of wetland • Loss of riperian vegetation • 1996 Total annual anthropogenic N inputs ~140Tg (Teragrams = 1 million metric tonnes)
Important nutrients N:P:Si esa.sdsc.edu/issues.htm • Ratios N:P and N: Si are especially important • P most important in freshwater lakes • N is usually limiting nutrient in coastal waters and estuaries. • P limitation has been documented in coastal waters and estuaries: • Apalachicola (Gulf of Florida) • some Dutch estuaries • Tropical systems with carbonate sands
Redfield ratio N:P 16:1 • N limited when <16:1 • P limited when >16:1 • Range of 10 to 25 is “normal” • N:P in sewage, manure and fertilizers is different from Refield ratio • N:Si 1:1 • Upstream eutrophication in rivers traps Si in sediments before it reaches estuaries • Dams: trap Si • Si availability controls diatom growth • Decrease in Si relative to N & P linked to HAB
Simplified N Cyclehttp://www.geog.ouc.bc.ca/physgeog/contents/9s.html
Biology of N • Gaseous N2 not useful to most photosynthesizers • N fixation • eg Trichodesmium can produce NH4 from N2 • Microbes and BG algae may form NO2 and NO3 • NH4, NO2 and NO3 can be used as nutrients by photosynthesizers • Proteins in Organic matter are excreted or decompose as NH4
Quantifying the N cycle • N cycle: • Natural Sources of N • Anthropogenic sources Natural Sources • Lightening fixation 5-10Tg pa • Natural N fixation (non crop)90-140 Tg p.a. • Marine fixation 30-300 Tg pa???
Anthropogenic sources of N • Industrial fixation inc Fertilizer 80Tg of N pa (NH3 & N2O) 2020 projection 134 Tg pa • Agricultural Legume Fixation32-53 Tg pa • Fossil fuels 20 Tg pa (NO & NH3) 2020 projection 46Tg pa • Forests Burning 40 Tg pa (NO, N2O & NH3 ) • Loss of wetlands (denitrifying) 10 Tg pa • Land clearing for crops 20 Tg pa • Domestic Animal Waste32 Tg pa (NH3)
NOx and NHx in the Atmosphere Origins • Domesticcombustion • Industrial processes • Traffic • Agricultural sources • Animal housing • Spreading of manure
Atmospheric Deposition of N in the North Atlantic Ocean • AD-Nto the NAObasin arises from pollution sources in North America and Western Europe • Sources have increased drastically (5-10-fold) since the Industrial Revolution and continue to increase in both geographic and depositional magnitude. • AD-N flux (11.2 Tg N yr-1 ) accounts for 46-57% of the total "new" or anthropogenic nitrogen flux to the NAO.
Human-Caused Global Nitrogen Emissions Ammonia data are fromSchlesinger and Hartley (1992) Nitric oxide fromDelmas et al. ,Nitrous oxide fromPrather et al. (1995). Human activities are responsible for alarge proportion of the global emissions of nitrogen-containing trace gases, including 40%of the nitrous oxide, 80% or more of nitric oxide, and 70% of ammonia releases. Increasing atmospheric concentrations of thegreenhouse gas nitrous oxide, of the nitrogenprecursors of smog, and of biologically availablenitrogen that falls from the atmosphere to fertilize ecosystems.
Loss of Wetlands • Important denitrifying zones • USA • Midwest 16 million hectares have been drained • eg Iowa had 1 million hectares, now has 16 000 hectares • Netherlands • most altered landscape • wetlands drained, network of canals pipe nutrients into coastal waters
Changes in N cycle Revised Kates et al. (1990). The chart shows the year whenchanges in human populationgrowth, carbon dioxide release,deforestation, and fertilizer production had reached 25%,50%, and 75% of the extentseen in the late 1980s.
Human alteration to N cycle • N has doubled in 50 years (C has only increased 10%) • 80 Tg of N pa applied as fertilizer • 174 kg/ha/pa Xs • Impacts include: • Increase N2O, (nitrous oxide, a greenhouse gas), due to burning of fossil fuels • Increased NO (nitric oxide, photochemical smog formation) • Acidification of soils and freshwater • Erosion & leaching of N to estuaries and coast
Transfers of nutrients • N fixed in industrial areas • N transported to agricultural areas • N applied to fields, some retained in crops • N loss to atmosphere and water • Crops transported to livestock producing areas and cities • Crops consumed in cities and N enters sewage • Animal feed crops consumed in livestock farms • Livestock transported to cities • Manure spread on fields, enters atmosphere and water
Natural transfers • Sea Birds and guano • Salmon migration and death
N input into Aquatic Systems Modifiedfrom Howarth et al. (1996) Movements of N into most of the temperate-zone rivers that empty into theNorth Atlantic Ocean have increased by 2 to 20-fold sincepre-industrial times. N increases in these rivers are highlycorrelated with increasing human-generated nitrogen inputs intothe watersheds, particularly fertilizer use and rising atmosphericdeposition of nitrogen.
Point Sources • Point sources: • Wastewater drains • Domestic Sewage • Sewage treatment plants • Livestock production • Storm sewers • Can monitor & regulate or treat
Non-Point Sources • Nonpoint sources • Agricultural runoff • Manure spreading • Atmospheric Deposition over water • Urban runoff & septic leachate • Seasonal effects eg rainfall, meltwater • Major source (~ 90 %) of N & P to surface waters • Diffuse, difficult to monitor or manage
Animal waste • USA 5 tonnes animal wastes per resident p.a. • Netherlands: (2000) • Human pop.= 15 700 000 • Cattle = 4 200 000 • Pigs = 14 000 000 • Chickens 108 000 000 • 6 tonnes animal wastes per resident pa • Government Levy Bureau monitor • Farm inputs (feeds,etc) • Output (meat & dairy) • Manure and what happens to it • Denmark (2004) • Human pop. 5 300 000 • Pigs 25 000 000
Fertilizer use http://www.efma.org • Industrial N fertilizer process invented during WW1 • Not widely used ‘til 1950’s • Steady increase ‘til late 1980s • Slight decline to 1994 (collapse of Soviet collective farms) • Rapid increase since 1995 (China & India) • 1996: annual fertilizer use ~83 Tg
N use in EU 1990-95Unit: kg nitrogen/ha utilised agricultural area (UAA)
About a third of nitrogen applied to agricultural land is not removed with the harvest (EEA) Nitrogen balance in EU agricultural soil 1990-95
Agriculture is the main source of nitrate pollution. Nitrogen run-off in areas with intensive agriculture is over 5, and often more than 10 times higher, than that from forested areas. EEA. Nitrogen run-off EU 1988 and 1996
Nitrate concentrations have been largely unchanged since 1980 NO3 in major EU rivers 1980-95 EEA
Nitrate concentrations in coastal waters fell in nearly half OSPAR and HELCOM coastal waters within the EU and Norway between 1985 and 1998. However, there were also some increases. EEA NO3in EU coastal waters 1985-98
Human alteration to P cycle • 600 Tg applied as fertilizer from 1950 to 1995 • ~250 Tg of P harvested as crops • ~50 Tg used as feed crops returned to soil as manure • Net XS addition 400 Tg in 45 years, ~10 Tg p.a.
Households and industry are the biggest contributors of phosphorus to the environment. However, in those parts of Europe with intensive agriculture, the contribution from agriculture approaches 50 % of the total. EEA. Sources of P in EU1988-96
Phosphorus concentrations in some EU rivers have fallen since the mid-1980s, particularly in the largest and most polluted rivers. EEA. P in major EU rivers 1980-95
Most coastal waters show little or no change in phosphate concentrations. However, there is a substantial decrease in 35 % of OSPAR and HELCOM coastal waters within the EU and Norway NO3 &PO4 in EU coastal waters, 1985-1996 Nutrient concentrations in coastal waters show little overall improvement