Download
1 / 30
330 likes | 472 Views
Learn how to calculate ratios, rates, prevalence, incidence, and mortality in the context of disease surveillance programs. Understand the importance of comparing data and using information effectively.

E N D
Measuring disease and death frequency Integrated Disease Surveillance Programme (IDSP) district surveillance officers (DSO) course
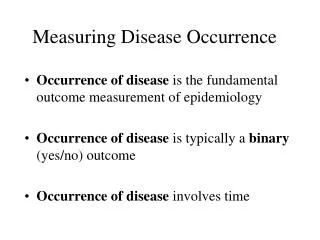
Outline of the session • Ratio, rate, proportion • Prevalence • Incidence • Relation between prevalence and incidence • Mortality 2
1.Question during an outbreak of hepatitis A in Sioux City, IA, USA: Are native Americans at higher risk? Number of new hepatitis A cases Native Americans: 19 (8% of cases) Others: 228 (92% of cases) Can you compare these two groups with this information? How can this information be used? Who can use this information? Count, divide and compare: Introduction 3
Count, divide and compare: 2. Divide the number of cases by the population Native Americans: 19/1,697 Others: 228/96,579 Introduction 4
Count, divide and compare: 3. Compare indicators Native Americans: 1,112 per 100,000 Others: 236/100,000/ yearRates among Native Americans are higher Introduction 5
A ratio places in relation two quantities that may be unrelated • The quotient of two numbers • Numerator NOT necessarily INCLUDED in the denominator • Allows comparing quantities of different nature: Female to male ratio = 5 / 2 = 2.5/1 Introduction 6
Examples of ratio • Number of doctor per beds • 1 doctor for 85 beds • Number of participants per facilitator • Sex ratio: Females / Males • Ratio of white blood cells to red blood cells • 1/600. What does it tell? • Number of children with scabies / number of children with malnutrition • Does it make sense? Introduction 7
A proportion measures a subset of a total quantity • The quotient of two numbers • Numerator NECESSARILY INCLUDED in the denominator • Quantities have to be of the same nature • Proportion always ranges between 0 and 1 • Percentage = proportion x 100 2 / 4 = 0.5=50% Introduction 8
Example of proportions • The proportion of children with scabies in a village • Tuberculosis cases in a district: • 400 males, 200 females • Question • What is the proportion of males among all cases? • What is the proportion of females cases among all cases? • Note: • All proportions are ratios • Is the converse true? Introduction 9
2 ----- = 0.02 / year 100 A rate measures the speed of occurrence of health events • The quotient of two numbers • Defined duration of observation • Numerator • Number of EVENTS observed for a given time • Denominator (includes time) • Population at risk in which the events occur Observed in 2004 Introduction 10
Example of rate • Mortality rate of tetanus in country X in 1995 • Tetanus deaths: 17 • Population in 1995: 58 million • Mortality rate = 0.03/100,000/year • Rate may be expressed in any power of 10 • 100; 1,000; 10,00; 100,000 Introduction 11
Prevalence – (P) • Number of existing cases (old and new) in a defined population at a specified point of time Number pf people with disease at a specified time P = ---------------------------------------------------- x 10n Population at risk at the specified time • In some studies the total population is used as an approximation if data on population at risk is not available Prevalence 12
Source and type of prevalence data • Surveys generate prevalence data • Prevalence data are expressed as proportions • Number affected / Number surveyed • The numerator is included in the denominator • The affected are only identified among the surveyed Prevalence 13
Example of point prevalence • 150 children in a school • Screening for visual acuity at a given time • 15 children require glasses • Prevalence of refractory errors • 15 / 150 = 10% Prevalence 14
Factors influencing prevalence • Number of new cases • Duration of the illness • If the disease is short, the prevalence is reduced • The prevalence of sudden infant death = 0(At a given instant, nobody has sudden infant death because the disease has no duration) • If the disease is long, the prevalence is increased • Rare lifelong disease can accumulate to build up a large prevalence Prevalence 15
Causes of increase of prevalence • Long duration • Low cure rate • Low case fatality • Increase in new cases • Immigration of patients • Improved detection • Emigration of healthy people Prevalence 16
Causes of decrease of prevalence • Shorter duration • High cure rate • High case fatality • Decrease in new cases • Emigration of patients • Improved cure rate • Immigration of healthy people Conclusion: Changes in prevalence may have many causes and may be difficult to interpret Prevalence 17
Uses of prevalence data • Assessing health care needs • Planning health services services • Measure occurrence of conditions with gradual onset • Study chronic diseases Prevalence 18
Incidence – (I) • Number of new cases in a given period in a specified population • Time, (i.e., day, month, year) must be specified • Measures the rapidity with which new cases are occurring in a population • Not influenced by the duration of the disease Incidence 19
Cumulated incidence - (CI) Number of new cases CI = -------------------------------------------------- x 10n Population at risk at the beginning • Also known as: • Attack rate • Assumes that the entire population at risk at the beginning was followed-up for the time period of observation Incidence 20
Source and type of incidence data • Surveillance generate incidence data • Incidence data are expressed as rates • Number affected / Population / time • Dynamic measure (speed) Prevalence 21
Uses of incidence data • Describe trends in diseases • Evaluate impact of prevention programmes Incidence 22
The dynamic of incidence and prevalence New cases Incidence Prevalence Death Cure Incidence and prevalence 23
The relation between prevalence and incidence • Prevalence depends on • Incidence (I) • Duration of the disease (D) P = I x D • Change in prevalence from one time period to another may be the result of changes in incidence rates, changes in the duration of disease, or both Incidence and prevalence 24
Patterns of incidence and prevalence • High prevalence and low incidence • e.g., Diabetes Mellitus • Low prevalence and high incidence • e.g., Common cold Incidence and prevalence 25
Evolution of HIV prevalence in a country scaling up public health efforts • Increase in HIV prevention • Reduction in incidence (Difficult to measure) • Increase in HIV AIDS care and support (treatment) • Increase in disease duration (reduced mortality) • Increase in prevalence (Easier to measure) • Incidence measures the impact of prevention efforts • Prevalence may be used to plan care and support • The immediate consequence of the plan may be an increased prevalence Incidence and prevalence 26
Crude mortality rate - (CMR) Number of deaths in a specified period CMR = ------------------------------------------------ x 10n Average total population • Does not take into account factors such as age, sex, race, socio economic status, etc. • Provides information on trends in a population’s health status Deaths 27
Disease specific mortality rate - (SMR) Number of deaths from a disease in a specified period SMR = ---------------------------------------------------------------- x 10n Average total population • Reflect the impact of a disease on a population in terms of death • Should not be confused with case fatality Deaths 28
Case fatality ratio of a given disease • Divide • Number of deaths from the disease • Number of cases of the disease • Example: Measles outbreak • 3 deaths • 145 cases • Case fatality ratio: 2.1% • Don’t mix up with disease-specific mortality! 29
Take home messages • Tell apart ratio, proportion and rates • Prevalence is a static measure taken at a point in time • Incidence is a dynamic measure taken over a certain time • Mortality is calculated using population denominators to reflect burden while case fatality is calculated using cases as denominators to reflect severity 30