Download
1 / 33
370 likes | 799 Views
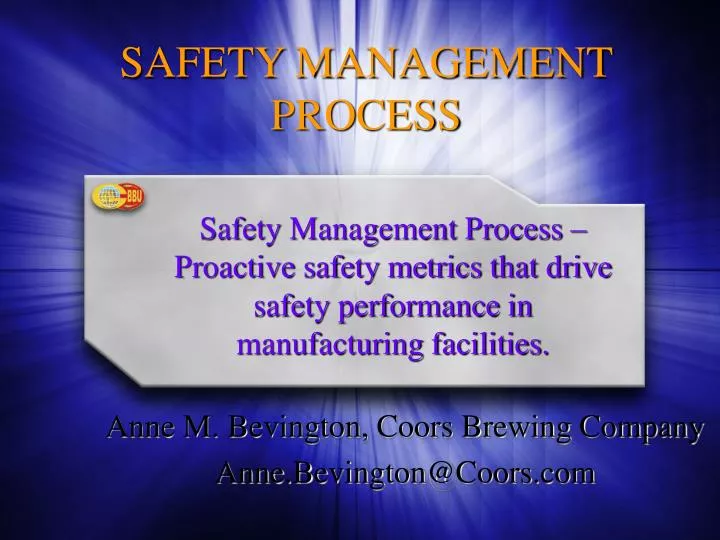
SAFETY MANAGEMENT PROCESS. Safety Management Process – Proactive safety metrics that drive safety performance in manufacturing facilities. Anne M. Bevington, Coors Brewing Company Anne.Bevington@Coors.com. Background about Coors.

E N D
SAFETY MANAGEMENT PROCESS Safety Management Process – Proactive safety metrics that drive safety performance in manufacturing facilities. Anne M. Bevington, Coors Brewing Company Anne.Bevington@Coors.com
Background about Coors Coors Brewing Company’s site in Golden, Colorado is the largest single site brewery in the US.
Introduction If you want to watch the video clip, click on the box below. Otherwise continue the slideshow. Total playing time: 02:56
Safety Management Process (SMP) SMP – WHAT is it? • Safety Management Tool that focuses on safety proactively vs. reactively • 100 Point Scoring Metric • Combination of 4 Primary Safety Metrics • Individual Participation • Group Participation • Compliance Training • Case Incident Rates • Process that creates involvement in safety
Safety Management Process (SMP) SMP - WHY Does it work • Proactive involvement in Safety drives results! • ACCOUNTABILITY!! Creates Individual, Team and Leadership Accountability for Safety • Provides a leading indicator vs. lagging • There is always FOCUS even when there is NOT an injury • Peer Pressure • Emphasis is on behaviors • Practical tool that people understand their impact
Safety Management Process (SMP) SMP – HOW Does it Work? • Simple Computer Database that tracks four categories and combines them for an overall SMP Score. • Constant feedback to areas from up to date reports accessible by all levels of the organization • All data is tracked at individual, team, department and plant level
Safety Management Process (SMP) SMP - WHO Does it? • Each employee must participate at defined levels for “credit” (2 Activities/month for 1,500 employees at GBBU, 1-5 Activities/month at other Coors facilities) • Teams (Areas, Departments) must proactively participate in Safety for Team Safety Score • Compliance Training must be completed by all team members • Reports are generated daily for review by all levels of the organization. • Individuals and Teams manage their safety not EHS
Elements of SMP Four Key Components • Individual Participation • Team Participation (Initiatives) • Compliance Training • Case Injury Rates Proactive Reactive
Individual Participation60 pts • Observation Cards • Job Safety Analyses • JSA Training • JSA Auditing • Safety Meetings • Safety Audits • Maintenance Walkthroughs • Pre-Shift Stretching • IH Sampling Requests • IH Sampling Results Team • Ergonomic Assessment Requests • Ergonomic Assessment Actions • Project Walkthroughs • Safety Workorders • Incident Reviews • Safety Visual Aids • Hazard Alerts • Individual Safety Initiative • Housekeeping Audit • PPE Fair • Safety Fair • Brown Bags • 90-100% 60 pts • 80-89 50 pts • 70-79 40 pts • 60-69 30 pts • 50-59 20 pts • 40-49 10 pts • < 40 0 pts
Participation If you want to watch the video clip, click on the box below. Otherwise continue the slideshow. Total playing time: 01:20
Team Safety 20 pts • Team Meetings/Safety 1st on Agenda (5 pts)* • Meeting Minutes • Team Initiatives (15 pts) • Team Initiative Form • Continued Progress period to period • Several team members participating
Team Initiatives If you want to watch the video clip, click on the box below. Otherwise continue the slideshow. Total playing time: 03:05
Compliance Training5 pts Courses that are required for ALL areas of plant • Points granted once 100% of team completes top 5 training courses • Once you earn points you get them the rest of year • All training is tracked in SMP
Plant Safety Incident Rates Team Safety Results15 Pts • Plant Total Case Rate (2.5 pts) • Plant Lost Work Case Rate (2.5 pts) • Team (Department/Line) No OSHA Recordable Injuries for period (10 pts)
Safety Management Process (SMP) SMP – Key Points • Each individual must participate in defined number of activities per month • Drives safety into organization at all levels • Gives everyone something to talk about and something to review specific to their involvement in safety • Keeps focus on compliance training • Gives tool to communicate back on what has been accomplished around safety – Corrective Actions, completed work orders, etc.
SMP and the EHS Professional If you want to watch the video clip, click on the box below. Otherwise continue the slideshow. Total playing time: 02:59
SMP – Other Reports • OSHA LOG • Root Cause Injury Reports • TEAM Initiative Report • TRAINING BY Person • Participation by Person, Team, Department • Corrective Action Reports • Injury Trending, Observation Trending, Etc.
SMP – Other Reports Case Incident Rates Safety Management Process Individual Employee Involvement Team Safety Compliance Training Plant Safe Days Worked Plant Case Incident Rates Plant Safety Management Process Plant Individual Employee Involvement Plant Team Safety Plant Compliance Training OSHA 300 report OSHA Recordables Report Team Safety Initiative Report - Team/Sub-Dept Team Safety Initiative Report – Dept Missing Employee Involvement Report by Team Team Safety Initiative Report – all Safety Observation Report – Detail Observation Report - Summary Participation Detail Participation Leaders Team Safety Detail Training Detail Training Completion Incident Report – All Incident Report – Recordables Incident Report – Leaders Incident Report – Laggers Incident Rate Report Scores Report – Departments Scores Report – Teams Combination Chart Training Complete For Year! Team Training History Incident Criteria Incident Corrective Actions - Open Issues Incident Corrective Actions – All Plant Combination Chart Safe Days Worked
Coors Golden Brewery 2004 SMP SummaryIt really does work! • Average SMP Score for plant 2004 74 • Highest SMP Scores P6, P7 and P8 • Lowest Injury periods P6, P7 and P8 • P6 – 4 Recordables • P7 – 4 Recordables • P8 – 3 Recordables
Coors Golden Brewery 2005 SMP SummaryIt really does work! • Average SMP Score for plant YTD 75 • 7 Recordables YTD • 1 Million Hours w/o Lost Time Injury - March 2005 • LWCIR 0.0 • Total Case 1.4
Coors - GBBU Vs. Industry Total Case Injury Rate 2002 2003 2005 YTD 2004 Goal 2005
SMP Driving Culture Change No Accountability Accountability No Visibility Visibility No Involvement Involvement Mistrust Trust We vs. They Us About injury #s SMP Numbers Top Down All levels Reactive PROACTIVE CULTURE SAFETY CULTURE
Safety Culture If you want to watch the video clip, click on the box below. Otherwise continue the slideshow. Total playing time: 02:01
SMP Software Solution • MS Access Database or Web based • Company Hierarchy Uploaded for each facility • Report generation is automated • Accomplishes other Regulatory Requirements • OSHA 300 • OSHA 301 • Incident Investigation Reports • Compliance Training Tracking
Safety Accountability for EmployeesSMP A Simple Software Solution Kathy Higgins, EHS Management Solutions, Inc. and Jeff Citrone, EHS Management Solutions, Inc. (303) 807-2933 khiggins@EHSMS.com jcitrone@EHSMS.com
Summary If you want to watch the video clip, click on the box below. Otherwise continue the slideshow. Total playing time: 02:17