Download
1 / 27
300 likes | 656 Views
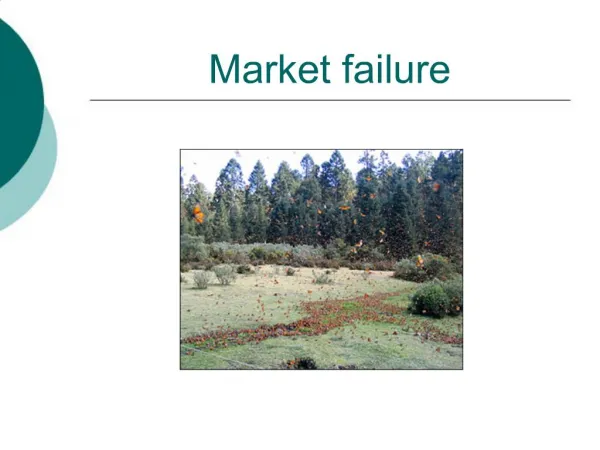
Market failure. Market failure in the Amsterdam office investment market Henk J. Brouwer. The problem (1). Market failure is a situation when free markets fail to allocate scarce resources efficiently This is the case in the Amsterdam office market: High long-term office vacancy rates

E N D
Market failure Market failure in the Amsterdam office investment market Henk J. Brouwer
The problem (1) • Market failure is a situation when free markets fail to allocate scarce resources efficiently • This is the case in the Amsterdam office market: • High long-term office vacancy rates • In many suburban areas 25% or even more • Construction of new offices continues
The problem (2) • Money is invested in new offices, while existing offices do not yield expected returns • Clearly waste of capital • Hypothesis: market failure related to lack of efficiency in the office investment market • We will try to substantiate this hypothesis
The problem (3) • KPMG (47,000 m2)
Efficiency (1) • Market failure is a fact, inefficient investment market most probable explanation • Efficiency of markets refers to how rapidly information is reflected in prices • Real estate is a long-term investment, so analysis of the future is important
Efficiency (2) • Rational investors will use their knowledge of the property market, the wider economy and the best available theories of how the two function and interrelate (Ball et al, 1998) • Actual market situation should result in adjustment of common expectations • This is not readily visible in investment market • So, investment market is not fully efficient
Recent history (1) • Strong employment growth in Amsterdam region in 1995-2009 • During ‘Golden Years’ (1996-2001) more new employment was created than in the preceding twenty years
Recent history (2) • Office construction boom from 1998-2002 • In 1999/2000 construction of more than 1m m2 of new offices started • Overall, in five years (1998-2002) a third added to the office stock
Recent history (3) • In 1999, actual availability of office space close to zero • In 2001, it was believed that high demand for offices was structural • Risk of insufficient capacity for office construction • Rezoning from mixed use to office park • Planning studies for underused land announced
Recent history (4) • Today, overall vacancy 20% • In many suburban areas over 25% • Structural vacancy is persistent, in spite of removals and transformation • However, vacancy concentrated in older offices (i.e. offices that have been used before)
Vacancy (2) • Following the end of the ‘Golden Years’ and completion of offices started in 1999/2000, vacancy soared • In 2004-2006 complete divergence of markets of newly built and older offices
Vacancy (3) • Supply of new offices triggered demand • Net take-up much lower than gross demand: from 2000 to 2010, net take-up of offices was only 15% of gross demand • Demand for new offices results in vacancy of older properties
The consequences (1) • Partition of the market into primary and secondary segments • Primary market fully marketable • Secondary market often difficult to let on conventional terms • Offices can move to secondary segment after only five to ten years
The consequences (2) • Major adjustment of reasonable expectations necessary • In 1999/2000/2001: strong demand for offices, low vacancy rate, shortages more probable than oversupply • Recently: many offices will be in primary market for 5-10 years and then move to secondary market with lower rents and higher vacancy rates
The consequences (4) • The space market is efficient, as the market segmentation is being reflected in rents • Pronounced adjustment in rental difference between new and older offices from 2004 to 2008 • Difference not yet sufficient to create equivalence
Expectations • Trends, as analysed before, can continue: strong preferences for new buildings, high supply elasticity • Are reasonable expectations, based on current trends, included in investment yields? • Difficult to know exactly • We have no more than a summary of the trends on the investment market (figures from JLL)
Analysis of yields (1) • When should adjustment of expectations have taken place? • It is more than simple information • Understanding of market processes necessary • Market participants have to appreciate underlying process, resulting in market segmentation
Analysis of yields (2) • Split of market as shown by diverging vacancy rates and prices takes place between 2004 and 2008 • Yields record low in 2006 and 2007 in line with comparable cities • Yields in Amsterdam start to remain higher as from 2008
Analysis of yields (3) • Yield difference with Munich and Stockholm lowest in 2006/2007: 45 bps • Rising to 75 bps in 2010 and even 115 bps in 2012 • Tentative conclusion: investment markets adjust to changed conditions, but with several years delay
Explanation (1) • German investors major buyers on Dutch office market • They were the first to spot opportunities in Amsterdam after 1994 • Since 1995, they account for 35% of office investments in The Netherlands • Estimated market share in Amsterdam area 50%
Explanation (2) • German funds invest on behalf of multitude of small private investors • Ultimate investor lacks insight in markets • Funds feel pressure to invest • Geltner, Miller et al (2007): duress can result in market inefficiency
Explanation (3) • Alternative analysis in recent report by CBRE: high vacancy rates in peripheral submarkets are common in other cities as well • However, this argument fails to consider that in Amsterdam peripheral areas with high supply elasticity account for 75% of the market
Explanation (4) • Vacancy rates
Conclusion • Market failure is a fact: waste of capital in office market • Lack of efficiency in office investment market is plausible • More research into market processes is important • Other points of interest: location patterns and supply elasticity