Download
1 / 18
180 likes | 295 Views
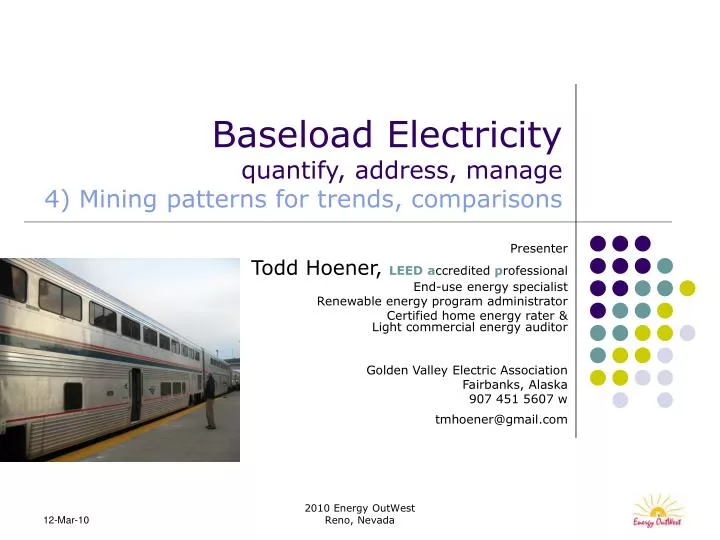
Baseload Electricity quantify, address, manage 4) Mining patterns for trends, comparisons. Presenter Todd Hoener, LEED a ccredited p rofessional End-use energy specialist Renewable energy program administrator Certified home energy rater & Light commercial energy auditor

E N D
Baseload Electricityquantify, address, manage4) Mining patterns for trends, comparisons Presenter Todd Hoener, LEEDaccredited professional End-use energy specialist Renewable energy program administrator Certified home energy rater & Light commercial energy auditor Golden Valley Electric Association Fairbanks, Alaska 907 451 5607 w tmhoener@gmail.com 2010 Energy OutWest Reno, Nevada
Determining baseload use Separate total annual residential electricity consumption into baseload & seasonal: • Review last 12 monthly electric use (kWh). • Add 3 or 4 lowest monthly electric use (kWh) (obtained from billing statements). • Average monthly electricity usage from these lowest use months (kWh). • Multiply calculated monthly baseload average (kWh) by 12 = estimate annual baseload electric use (kWh). 2010 Energy OutWest Reno, Nevada
Baseload calculation example 2010 Energy OutWest Reno, Nevada
What is “normal” use? Depends. Lots of variables: Home alone? Everybody home? Operate a business in home? Never home? There is no “normal” use, but assessments & comparables may be drawn • Count up appliances & add up nameplates wattages • Monitor usage or control & log actions • Spot trends. Compare daily kWh averages & electricity use indexes (annual kWh / s.f.) • Start benchmarking (a dynamic activity that continually fine-tunes itself) 2010 Energy OutWest Reno, Nevada
Electricity usage numbers 2010 Energy OutWest Reno, Nevada
EOW daily kWh average 2010 Energy OutWest Reno, Nevada
Creating a context for comparing • Focus on baseload use, not total: separate • Focus on low-income households (weatherization target) • Construct a starting point framework called “benchmarking” using “electricity index” & “daily kWh average” to establish “normal”, “high”, or “low” use • This framework should be flexible & dynamic as more information is collected 2010 Energy OutWest Reno, Nevada
Rough electricity use index Known: National kWh annual average (US DOE EIA) Average sizes of detached single family house unit, 2004 (NAHB, Census) and mobile home Questionable: Number of housing members? Electricity use probably not similar in comparables? Baseload electricity use percentage? 2010 Energy OutWest Reno, Nevada
Rough electricity (kWh) index 2010 Energy OutWest Reno, Nevada
EOW states’ annual kWh averages Starting point for Western region electricity index framework benchmark 2010 Energy OutWest Reno, Nevada
Rough EOW region index calc Sampling of “typical” low-income house sizes based on National trends & percentages (Census – thus, all states similar) Again, no information about household member sizes – which would have affect on electricity use 2010 Energy OutWest Reno, Nevada
EOW electricity indexes Benchmarks on “average” typical low-income housing units (detached, rental, mobile home) “Average” sizes, downsized according to trends Baseload percent of total assumed 50% (we’ve already seen 75%) 2010 Energy OutWest Reno, Nevada
EOW benchmarks graphed Assume 50% baseload (we’ve seen higher percent Assume average housing unit sizes 2010 Energy OutWest Reno, Nevada
Comparing (with assumptions) Attempt to carve out a benchmark Crude attempt; lots unknown 2010 Energy OutWest Reno, Nevada
Energy intensity benchmarking Energy intensity assessment method • Comparing similar building electricity use based on kilowatt-hour/square foot (additionally, per degree days) • I.e., energy metric/area/climate over some time period • Simplest method = annual kWh/s.f. • Pitfalls: Empty vs. occupied houses, number of occupants, occupant behaviors, equipment choices & operation, climate, building design, etc. • Benefit: Fast estimate for comparisons 2010 Energy OutWest Reno, Nevada
Comparing with “Yardstick” ENERGY STAR attempt to carve out a benchmark & compare use across regions energystar.gov/index.cfm?fuseaction=HOME_ENERGY_YARDSTICK.showGetStarted 2010 Energy OutWest Reno, Nevada
Section points • Use data to compare, track trends, assume some level of “normal”, “high” or “low” use • Calculate daily kilowatt-hour average for benchmarking purposes • Determine specific annual kWh use & housing unit area (square feet) to calculate electricity use index for residence & benchmarking purposes • Compare between & across similar & different households for local benchmarking 2010 Energy OutWest Reno, Nevada
2010 Energy OutWest Reno, Nevada