Download
1 / 54
540 likes | 771 Views
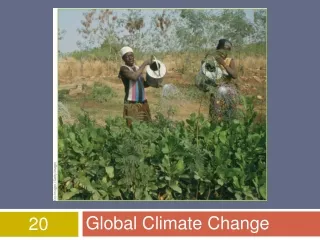
Global Climate Change. James Hansen 1 February 2010 University of North Carolina Chapel Hill, NC. What Must We Do Now? *. * Statements relating to policy are personal opinion. Global Warming Status 1. Knowledge Gap Between - What is Understood (scientists) - What is Known (public)

E N D
Global Climate Change James Hansen 1 February 2010 University of North Carolina Chapel Hill, NC What Must We Do Now?* *Statements relating to policy are personal opinion
Global Warming Status 1. Knowledge Gap Between - What is Understood (scientists) - What is Known (public) 2. Planetary Emergency - Climate Inertia Warming in Pipeline - Tipping Points Could Lose Control 3. Bad News & Good News - Safe Level of CO2 < 350 ppm - Multiple Benefits of Solution
Climate Tipping Points 1. Ice Sheet Disintegration - Ocean Warming Ice Shelves Melt Ice Streams Surge Disintegration 2. Species Extermination - Shifting Climate Zones, Multiple Stresses, Species Interdependencies 3. Methane Hydrate ‘frozen methane’ - In Tundra & On Continental Shelves - Depends On Ocean & Ice Sheets
Analysis of global surface temperature change. Green vertical bar is estimated 95 percent confidence range. Base period = 1951-1980.
60-month (5-year) and 132-month (11-year) mean temperature anomaly relative to 1951-1980 mean. Input data extend through December 2009. Source: Hansen et al., GISS analysis of surface temperature change. J. Geophys. Res.104, 30997-31022, 1999.
Surface temperature anomalies in (a) Dec and (b) Jun-Jul-Aug 2009 relative to 1951-1980Source: Hansen et al., GISS analysis of surface temperature change. J. Geophys. Res.104, 30997-31022, 1999.
Positive AO: low pressure in Arctic, strong zonal winds keep cold air confined to Arctic.Negative AO: high pressure in Arctic, weak zonal winds facilitate cold air outbreaks. December 2009
Basis of Understanding 1. Earth’s Paleoclimate History 2. On-Going Global Changes 3. Climate Models (note: modeling #3, but aids other two)
50 million years ago (50 MYA) Earth was ice-free. Atmospheric CO2 amount was of the order of 1000 ppm 50 MYA. Atmospheric CO2 imbalance due to plate tectonics ~ 10-4 ppm per year.
Cenozoic Era End of Cretaceous (65 My BP) Present Day
50 million years ago (50 MYA) Earth was ice-free. Atmospheric CO2 amount was of the order of 1000 ppm 50 MYA. Atmospheric CO2 imbalance due to plate tectonics ~ 10-4 ppm per year.
Summary: Cenozoic Era 1. Dominant Forcing: Natural ΔCO2 - Rate ~100 ppm/My (0.0001 ppm/year) - Human-made rate today: ~2 ppm/year Humans Overwhelm Slow Geologic Changes 2. Climate Sensitivity High - Antarctic ice forms if CO2 < ~450 ppm - Ice sheet formation reversible Humans Could Produce “A Different Planet”
Earth’s history provides important information on global warming. Recorded human history occurs within the Holocene warm period.
CO2,CH4 and estimated global temperature (Antarctic ΔT/2 in ice core era) 0 = 1880-1899 mean. Source: Hansen, Clim. Change, 68, 269, 2005.
(A) Forcings used to drive climate simulations. (B) Simulated and observed surface temperature change. Source: Earth's energy imbalance: Confirmation and implications. Science308, 1431, 2005.
(A) Net Radiation at top of atmosphere in climate simulations. (B) Ocean heat gain in the top 750 m of world ocean. Source: Hansen et al., Science, 308, 1431, 2005.
Heat storage in upper 2000 meters of ocean during 2003-2008 based on ARGO data(Schuckmann et al. J. Geophys. Res. 114, C09007, doi:10.1029/2008JC005237, 2009)
Implications of Planet’s Imbalance 1. Humans are Driving Climate Change GHG forcing + Ocean inertia Imbalance 2. Additional Warming in Pipeline ¾ W/m2 imbalance >0.5°C warming 3. Accelerating Ice Sheet Disintegration Ocean heat is melting ice shelves, which buttress the ice sheets
Surface Melt on Greenland Melt descending into a moulin, a vertical shaft carrying water to ice sheet base. Source: Roger Braithwaite, University of Manchester (UK)
Jakobshavn Ice Stream in Greenland Discharge from major Greenland ice streams is accelerating markedly. Source: Prof. Konrad Steffen, Univ. of Colorado
Gravity Satellite Ice Sheet Mass Measurements Greenland Ice Sheet Antarctic Ice Sheet Source: Velicogna, I. Geophys. Res. Lett., 36, L19503, doi:10.1029/2009GL040222, 2009.
Arctic sea ice area at warm season minimum. Data Source: National Snow and Ice Data Center
Pier on Lake Mead Subtropics are expected to expand with global warming. Observations show, on average, 4 degrees of latitude expansion.
Fires Are Increasing World-Wide Wildfires in Western US have increased 4-fold in 30 years. Western US area burned Source: Westerling et al. 2006
Rongbuk Glacier Rongbuk glacier in 1968 (top) and 2007. The largest glacier on Mount Everest’s northern slopes feeds Rongbuk River.
Stresses on Coral Reefs Coral Reef off Fiji (Photo credit: Kevin Roland)
Assessment of Target CO2 PhenomenonTarget CO2 (ppm) 1. Arctic Sea Ice 300-350 2. Ice Sheets/Sea Level 300-350 3. Shifting Climatic Zones 300-350 4. Alpine Water Supplies 300-350 5. Avoid Ocean Acidification 300-350 Initial Target CO2 = 350* ppm *assumes CH4, O3, Black Soot decrease
Target CO2: < 350 ppm To preserve creation, the planet on which civilization developed
Scenarios assume no “Other” = Tar Sands, Oil Shale, Methane Hydrates Coal phase-out by 2030 peak CO2 ~400-425 ppm, depending on oil/gas. Faster return below 350 ppm requires additional actions Source: Hansen et al., Target atmospheric CO2: where should humanity aim? Open Atmos. Sci. J., 2, 217-231, 2008.
Initial Target CO2: 350 ppm Technically Feasible Quick Coal Phase-Out Necessary No new coal w/o CO2 capture All coal phased out within 20 years No Unconventional Fossil Fuels Tar Sands, Oil Shale, Methane Hydrates
What’s Really Happening (USA) 1. Tar Sands agreement with Canada Pipeline planned to transport oil 2. Oil Shale under development Twice CO2/energy of conventional oil 3. New Coal-fired power plants Rationalized by ‘Clean Coal’ mirage 4. Mountaintop removal proceeds Destroys wind potential of mountains
Global Action Status • Huge Gap: Rhetoric & Reality - Rhetoric: Planet in Peril - Reality: Small Perturbations to BAU 2.Greenwash/Disinformation Winning - Appeasement of Fossil Interests - Still Waiting for a Winston Churchill 3.Kyoto & Copenhagen Fiascos - Kyoto accelerating emissions - Copenhagen same “indulgences”
Problem & Solution • Fossil Fuels are Cheapest Energy - Subsidized & Do Not Pay Costs - Solution: Rising Price on Carbon 2.Regulations also Required - Efficiency of Vehicles, Buildings,e.g. - Carbon Price Provides Enforcement 3.Technology Development Needed - Driven by Certainty of Carbon Price - Government Role Limited
Fee & Dividend 1. Fee Applied at First Sale/Port of Entry Covers all Oil, Gas, Coal No Leakage 2. Fee Specified: No Speculation, No Volatility No Wall Street Millionaires at Public Expense 3. Fee & Dividend (vs. Cap-and-Trade) Not One Dime to Goldman-Sachs et al. Can be Implemented in Months Market Chooses Technology Winners British Columbia Example: Public Likes It
Carbon Fee & 100% Dividend (consider: $115/ton CO2 = $1/gal. gas) 1. Yield ~ $670B (U.S. example) 2. Dividend (bank acct or debit card) Adult Legal Resident ($250/month = $3000/year) Family with 2 Children ($750/month = $9000/year)
Fee & Dividend Addresses 1. Economy: Stimulates It Puts Money in Public’s Hands– A Lot! 2. Energy: Fossil Fuel Addiction Fastest Route to Clean Energy Future 3. Climate Only Internationally Viable Approach - - Zero Chance of China/India Accepting a Cap Would Result in Most Coal & Unconventional Fossil Fuels, some Oil left in the Ground
Universality, Fairness 1. Fees almost Universally Beneficial No Country Covets Fossil Fuel Addiction 2. Duties on Products from no-fee Areas Use for Mitigation/Adaptation Aid 3. Fairness: Reward Best Practices Use Duties preferentially for Countries that address Population (e.g., women’s education)
So What’s the Problem Today? 1. Fossil Fuels Still Priced Lowest Fossil Fuels Subsidized No Charge for Damages (Health, etc.) 2. Governments Under Fossil Thumbs Greenwash Instead of Leadership 3. Revolving Door in Washington Hatch Schemes for Business-as-Usual Favoring Big Banks, Fossil Fuel Industry
Cap-and-Trade-and-Offsets 1. Cap Approach Can’t Go Global China & India will never accept caps 2. Cap Dishonest: Pretends at Low Cost Actually expensive (very inefficient) 3. Cap Comes with Offsets Actual GHG reductions small 4. Cap causes Volatile Carbon Price Discourage business/consumer investing
Cap-and-Trade: Why??? 1. C&T Designed for Big Banks Top Two: JP MorganChase, Goldman Sachs 2. C&T Designed for Special Interests 2000-Page Bills Written by Special Interests Why??? Revolving Door Between Wall St. & Washington Revolving Door Between Lobbyists & Congress That’s the way the system seems to work now.
Intergenerational Justice Jefferson to Madison: …self-evident that “the Earth belongs in usufruct to the living”* Native Americans: obligation to 7th generation Larry King: “nobody cares about 50 years from now” Governments (with fossil interests): we can set emissions at whatever level we choose Public: when will it become involved? *Legal right to use something belonging to another