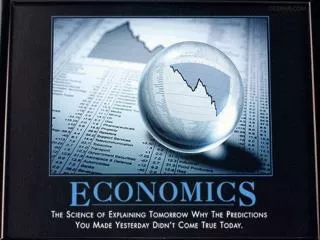
Download

1 / 64
640 likes | 776 Views
Supply and Demand !!!!. Applications and Extensions. Overview. 1. Demand the demand curve consumer surplus quantity demanded vs. demand shifters of demand 2. Supply the supply curve producer surplus quantity supplied vs. supply shifters of supply. Overview.

E N D
Supply and Demand !!!! Applications and Extensions
Overview 1. Demand • the demand curve • consumer surplus • quantity demanded vs. demand • shifters of demand 2. Supply • the supply curve • producer surplus • quantity supplied vs. supply • shifters of supply
Overview 3. Market Equilibrium: • Efficiency • Single and double shifts of supply and demand 4. The resource market (particularly the labor market) 5. Price Controls: price floors and ceilings (surpluses and shortages) 6. Impact of a tax 7. The tax system 8. The Laffer curve 9. Subsidies
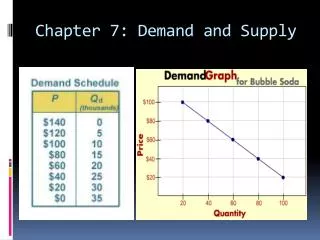
The Demand Curve Law of demand: There is an inverse (negative) relationship between the price of a good and the quantity that buyers are willing to purchase Results in a downward sloping demand curve.
The Demand Curve Ex. Deriving the Demand Curve *Note*: As price increases, quantity demanded decreases.
The Demand Curve The height of the demand curve at any quantity shows the maximum price that consumers are willing to pay for an additional unit. Notice that when consumers have more of the good they value it less.
Consumer surplus Consumer surplus: The difference between the maximum amount consumers would be willing to pay and the amount that they actually pay. Consumer surplus is the area below the demand curve but above the price. ex. What happens if price falls? rises?
Demand vs. Quantity Demanded Change in quantity demanded: A movement along the curve Caused by: a change in the price of that good • Increase in quantity demanded: movement down the curve (to the right) • Decrease in quantity demanded: movement up the curve (to the left)
Demand vs. Quantity Demanded Change in demand: a shift of the curve Caused by: a change in anything that affects demand other than the price of the good • Increase in demand: curve shifts right • Decrease in demand: curve shifts left
Shifters of Demand 1. Change in consumer income A. Normal goods (Steak) B. Inferior goods Ramen Noodles
Shifters of Demand 2. Change in number of consumers Ex. Change in class size
Shifters of Demand 3. Change in the price of a related good A. Substitutes (Beef and Chicken) B. Compliments (Milk and Cereal)
Shifters of Demand 4. Change in expectations A. Expected change in price B. Expected change in income
Shifters of Demand 5. Change in consumer tastes and preferences. Ex. What do you think will happen to the demand for Kanye West posters?
Examples What would happen to demand? • What would happen to the demand for Beef if the price of chicken increased? • What would happen to your demand for shrimp (a normal good) if your income decreased? • What would happen to the demand for milk if the price of milk fell?
The Supply Curve The law of supply: There is a direct (positive) relationship between the price of a good or service and the amount that suppliers are willing to produce Results in an upward sloping supply curve
The Supply Curve Ex. Deriving the Supply Curve *Note*: As price increases, quantity supplied increases.
The Supply Curve The height of the supply curve indicates the minimum price necessary to induce producers to supply that additional unit
Producer Surplus Producer surplus: The difference between the minimum price suppliers are willing to accept and the price they actually receive. Producer surplus is the area above the supply curve but below price. ex. What happens if price falls? Rises?
Supply vs. Quantity Supplied Change in quantity supplied: a movement along the curve Caused by a change in the price of that good: • Increase in quantity supplied: Movement up the curve (to the right) • Decrease in quantity supplied: Movement down the curve (to the left)
Supply vs. Quantity Supplied Change in supply: A shiftof the curve Caused by a change in anything that affects supply other than the price of the good • Increase in supply: curve shifts right • Decrease in supply: curve shifts left
Shifters of Supply 1. A change in resource price ex. An increase in the price of steel
Shifters of Supply 2. A change in technology ex. The printing press
Shifters of Supply 3. Changes in nature and politics ex. Crop Freeze
Shifters of Supply 4. Changes in taxes ex. Yacht tax
Elasticity 1. Elasticity of Demand A. Inelastic Demand: Quantity demanded is NOT sensitive to changes in price. (inelastic demand curves are steeper) B. Elastic Demand: Quantity demanded is sensitive to changes in price. (elastic demand curves are flatter)
Elasticity 2. Elasticity of Supply A. Inelastic Supply: Quantity supplied is NOT sensitive to changes in price. (inelastic supply curves are steeper) B. Elastic Supply: Quantity supplied is sensitive to changes in price. (elastic supply curves are flatter)
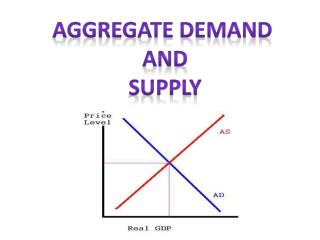
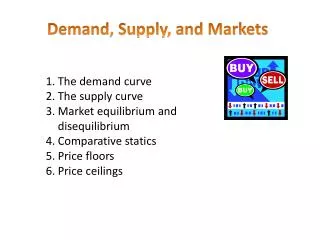
Market Equilibrium! A state in which the conflicting forces of supply and demand are in balance. Occurs where the demand curve intersects the supply curve.
Market Equilibrium! In market equilibrium: • all trades that generate more benefit then costs are undertaken • No trades where costs exceed benefits are undertaken • The combined area of consumer and producer surplus is maximized
Market Equilibrium! The market equilibrium is economically efficient. Efficient: no excess supply or excess demand • Excess supply: quantity supplied > quantity demanded • Excess demand: quantity demanded > quantity supplied
Changes in Demand Demand changes: • Price: moves in same direction • Quantity: moves in same direction ex. Demand increases • Price increases • Quantity increases
Changes in Supply Supply changes: • Price: moves in opposite direction • Quantity: moves in same direction ex. Supply increases • Price decreases • Quantity increases
Changes In Both? What happens if supply and demand both increase at the same time?
The Labor Market • Price for labor is called the wage (W) • Quantity of labor is called employment (E) *Note: works just like the market for goods, only with a different name for price (wage) and quantity (employment)
Labor Demand 1. Firms demand labor 2. Labor demand curve is downward sloping because as wage decreases, firms will want to employ more people
Changes in Labor Demand 1. An increase in labor demand (labor demand shifts right) 2. A decrease in labor demand (labor demand curve shifts left)
Labor Supply 1. Workers supply labor 2. Labor supply curve is upward sloping because as wage increases, people will want to work more.
Changes in Labor Supply 1. Increase in labor supply: (labor supply curve shifts right) 2. Decrease in labor supply: (labor supply curve shifts left)
Linking the Markets There is a close relationship between the demand for products and the demand for resources used to make those products
Linking the Markets when the demand for a product changes, the demand for the resources used to produce it will change in the same direction
Price Floor Price floor: A legally established minimum price buyers must pay for a good or resource • A price floor above equilibrium price creates a surplus • A price floor below equilibrium price does nothing
Surplus Surplus: A condition in which the amount offered for sale is greater than the amount that buyers will purchase at existing prices. Also known as excess supply: Quantity supplied > Quantity demanded
Application: Minimum Wage The minimum wage is an example of a price floor. Raising minimum wage increases excess labor supply (unemployment).
Price Ceiling Price ceiling: A legally established maximum price sellers can charge for a good or resource • A price ceiling below market equilibrium price creates a shortage • A price ceiling above market equilibrium price does nothing
Shortage Shortage: a condition in which the amount offered for sale is less than the amount demanded by buyers at existing prices Also known as excess demand: Quantity demanded > Quantity supplied
Application: Rent Control Rent controls lead to shortages as well as: • A decline in the supply of future rental housing • A decline in quality of rental housing • Non-price methods of rationing • Inefficient housing match-ups • Black Markets