Download
1 / 15
150 likes | 346 Views
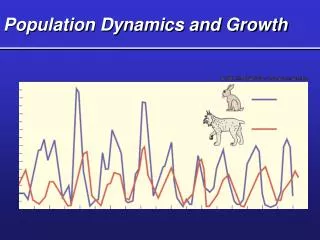
Population Dynamics and Growth. Pre AP Biology Spring ‘12. Competition. Competition occurs when 2 or more species use the same resource. Examples of the resource are: Food Light Space Shelter Water Nesting sites. Limiting factors.

E N D
Population Dynamics and Growth Pre AP Biology Spring ‘12
Competition • Competition occurs when 2 or more species use the same resource. • Examples of the resource are: • Food • Light • Space • Shelter • Water • Nesting sites
Limiting factors • Limiting factors are the biotic and abiotic factors in an ecosystem that limits the existence, numbers or reproduction the organisms in that environment. Popu l a t i on Zone of stress optimum conditions stress zone of Intolerance intolerance Low ENVIRONMENTAL FACTOR High
Limiting Factors • Examples of limiting factors: • Temperature: organisms have an optimum temperature range in which they can survive. • CO2 levels • O2 levels • Humidity • Amount of sunlight • Prey availability • Mineral availability
Kinds of Limiting Factors • Density-dependent – has an increasing effect as population increases. Usually biotic. ex: disease, parasites, competition for food • Density-independent – has an effect on all populations regardless of their population. Usually abiotic. ex: sunlight, temperature
How Predation Helps • Predators help keep population size within the limits of available resources.
Limiting factor graph (example) • Graph the temperature tolerance for 2 species of plants (aloe vera and ivy). The data is in sets of three: A, B, C A = temperature B = number of aloe vera C = number of ivy Use 2 different colors. Remember every graph needs a title, x and y axis labeled, and a legend
Data • 0,0,0; • 10,0,0; • 20,0,2; • 30,0,10; • 40,2,20; • 50,5,40; • 60,10,60; • 70,12,70; • 80,30,60 • 90,50,30; • 100,40,10; • 110,20,2 • 120,5,0 • 130,0,0 • 140, 0,0
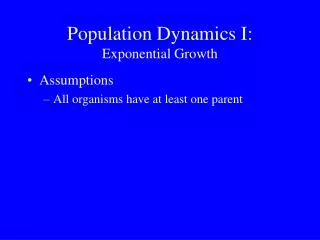
Population Growth • Population growth is a change in population with time • 3 kinds of growth graphs: • Linear growth • Exponential growth • Logistic growth
Logistic is most common • Linear growth almost never occurs. It assumes the exact same rate of growth. (If every 2 people had 3 children…we’d replace ourselves + 1) • Population growth is sometimes exponential if resources are unlimited • Logistic growth is the most common because it represents exponential growth until resources limit growth and it levels out.
Carrying capacity • Carrying capacity – number of organisms of a population that an environment can support 2 kinds of strategists or patterns of population growth: r-strategists k-strategists
R-strategists • Have a rapid period of population growth • The rapid growth far exceeds carrying capacity • Rapid growth followed by a crash • After the crash there is another period of rapid growth, etc. • This organisms have many offspring, don’t care for their young, and have short life • Examples: bugs and fish
K-strategists • Have a long period of slow growth • Then they reach the carrying capacity. • At that point they have minor fluxuations in growth around carrying capacity. • They have few young, a long life, and tend to take care of their young. • Examples: most mammals
Homework • Answer the following questions about the graph. • Give the zones of intolerance for aloe vera and for ivy? • What is the optimum temperature for aloe vera? • Which plant grows better outside in South Texas? • How could a person who owns a gardening store use this information?
Pre AP homework • 5. Read page 370 and answer question #2 and #3 on page 370. I expect more than a sentence answer. Your answers should fill more than a half a page.