Download
1 / 13
130 likes | 255 Views
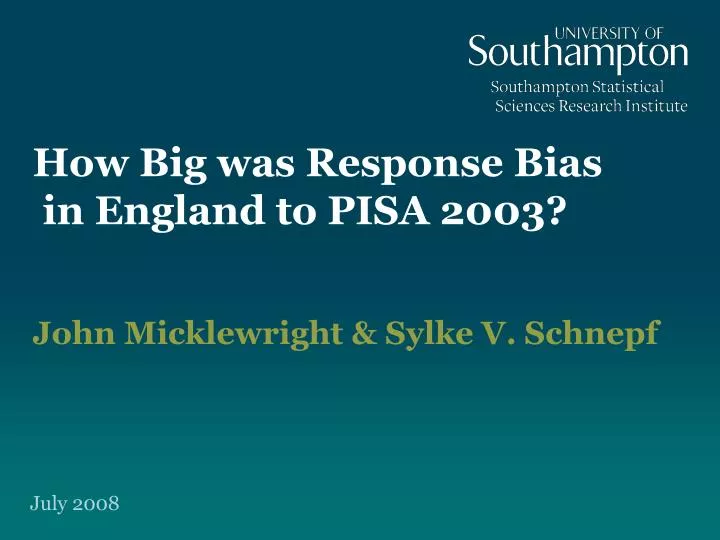
How Big was Response Bias in England to PISA 2003?. John Micklewright & Sylke V. Schnepf. July 2008. Motivation. PISA – Programme of International Student Assessment Reports from OECD for 2003 exclude the UK due to perceived non-response bias in England

E N D
How Big was Response Bias in England to PISA 2003? John Micklewright & Sylke V. Schnepf July 2008
Motivation • PISA – Programme of International Student Assessment • Reports from OECD for 2003 exclude the UK due to perceived non-response bias in England • Simon Briscoe, Economics Editor at The Financial Times: the exclusion is among the ‘Top 20’ recent threats to public confidence in official statistics in the UK Presentation draws on: • Response Bias in England in PISA 2000 and 2003, DfES Research Report 771
‘Bias’ in what? • Mean • Variance • % beneath a given threshold
Five groups of 15 year olds • all pupils in England (less permitted exclusions from the target population) • all pupils in sampled schools (initial, 1st repl., 2nd repl.) • all pupils in responding schools • sampled pupils in responding schools • responding pupils
What we do • Show how (i) mean, (ii) variance, and (iii) % < thresholds of KS3 and KS4 scores change from group to group • Estimate biases in these 3 measures of PISA scores in group v, focusing on problem of pupil response • Look at both 2000 and 2003
KS4 v. PISA scores - respondents PISA maths score R = 0.78 KS4 score
Creating response weights Model probability of pupil response for sampled pupils in responding schools (group iv) Prob(response)i = F(domestic test scorei, other characteristicsi) Predicted probability of response KS4 score
Bias due to pupil response Extent of bias, calculated as number of PISA score points (PISA international mean = 500, international SD = 100 Compare with the estimated standard errors (SEs) of the mean and SD for England in 2003: SE (mean) = 2.9 (reading and maths) and 3.0 for science SE (SD) = 1.6 (reading and maths) and 1.7 for science
However… • Adjusting the mean by the estimated bias of about 6 points moves England one place in the country rankings • ‘Post-stratification’ weights are used in many surveys – they could be provided with the data for England • Think of possible biases in countries just above the 80% student response threshold (Australia, Austria, Canada, Ireland, Poland and the USA)
Conclusions • It is possible to assess reliably both the direction and magnitude of response biases in England in 2003, and hence compare UK scores with those for other countries • The extent of the bias in means and SDs of scores is equal to about double the SEs, but the impact on ‘league table’ rankings is small • Biases were similar in 2000, when pupil response in England just reached the required threshold