Download
1 / 10
130 likes | 481 Views
TOOLS OF TQM. Abdulla Jassim Abdulla. INTRODUCTION . Data-Driven Methodology Data generated by processes. Statistical interpretation. Seasonal variations. New Technology. THE ‘SEVEN SIMPLE TOOLS’ . Flowcharts Cause and Effect (Ishikawa / fishbone) Diagrams Check sheets

E N D
TOOLS OF TQM Abdulla Jassim Abdulla
INTRODUCTION • Data-Driven Methodology • Data generated by processes Statistical interpretation Seasonal variations New Technology
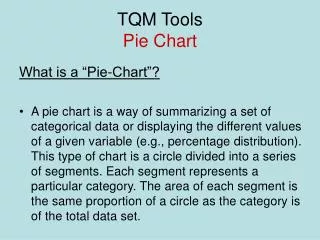
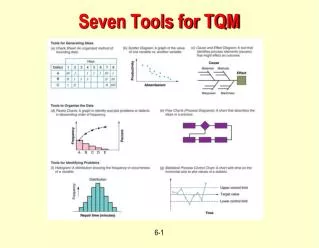
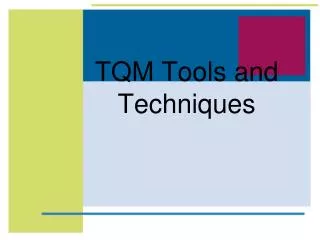
THE ‘SEVEN SIMPLE TOOLS’ • Flowcharts • Cause and Effect (Ishikawa / fishbone) Diagrams • Check sheets • Pareto Charts • Histograms • Run Charts and Control Charts • Scatter plots and Correlation Analysis
FLOWCHARTS • Remember system theory: (Input, Output, customer supplier and their interactions). • Divide complex processes into simple sub-processes. • A Qualitative tools
Patient Transport Process Example Request made Log & prioritize request Dispatch transport Take patient to X-ray Doctor determines patient needs X-ray Information taken & request is logged Required equipment is found Transporter arrives on ward Patienttransferredfrombed Ward contacts dispatcher Request prioritized Transport is dispatched Patient taken to X-ray
Types of Flowcharts • LAYOUT FLOWCHART Example Staff movement • DATA FLOW DIAGRAMS leave approval process
ISHIKAWA DIAGRAMS • Also known as Fishbone or Cause-and-Effect Diagrams • Non-quantitative tools (Qualitative) • Sometimes called the 5M Diagram (Men, Machine, Materials, Measurements and methods)
CHECKSHEETS • Central tool for Quality Assurance programs • Specially useful for operational procedures • Could be derived from the flowchart and fishbone diagrams