Download
1 / 13
130 likes | 156 Views
Learn the appropriate methods for conducting meta-analyses in growth studies to garner valuable insights from various sources and optimize data interpretation. Resources and guidelines provided by leading experts.

E N D
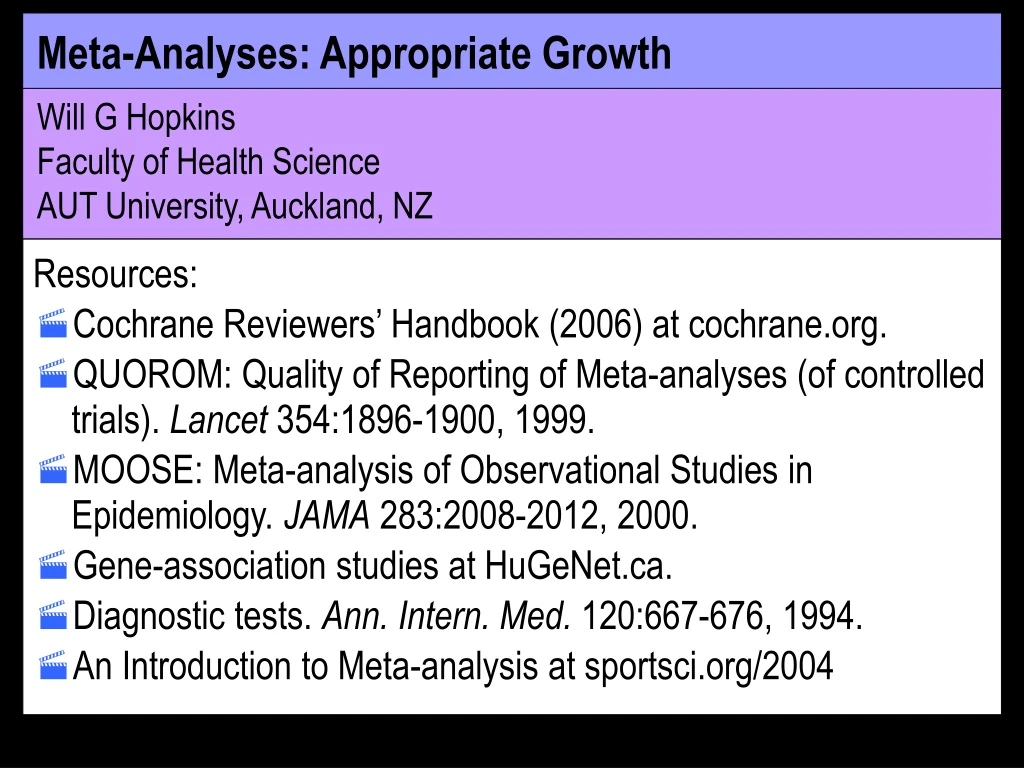
Meta-Analyses: Appropriate Growth Will G HopkinsFaculty of Health ScienceAUT University, Auckland, NZ Resources: • Cochrane Reviewers’ Handbook (2006) at cochrane.org. • QUOROM: Quality of Reporting of Meta-analyses (of controlled trials). Lancet 354:1896-1900, 1999. • MOOSE: Meta-analysis of Observational Studies in Epidemiology. JAMA 283:2008-2012, 2000. • Gene-association studies at HuGeNet.ca. • Diagnostic tests. Ann. Intern. Med. 120:667-676, 1994. • An Introduction to Meta-analysis at sportsci.org/2004
Overview • A meta-analyzed estimate of an effect is: • an average of qualifying study-estimates of the effect, with… • …more weight for study-estimates with better precision, • …adjustment for and estimation of effects of study characteristics, • …accounting for any clustering of study-estimates, • …accounting for residual differences in study-estimates. • Possible problems with the Cochrane Handbook and the Review Manager software (RevMan).
This: rather than this: meta-analysis 100(eanswer-1)% An average of qualifying study-estimates of the effect • Studies that qualify • Spell out selection criteria: design, population, treatment. • Include conference abstracts to reduce publication bias due to journals rejecting non-significant studies. • Averaging requires estimates of effects in the same units: • Averaging effects derived from continuous variables • Aim for dimensionless units, such as change in % or % change. • Convert % changes in physiological and performance measures to factor changes then log transform before meta-analysis. • Important when effects are greater than ±10%. • 37% 1.37 log(1.37) • -60% 0.40 log(0.40) • 140% 2.40 log(2.40)
Physical performance is best analyzed as % change in mean power output, not % change in time, because… a 1% change in endurance power output produces… • 1% in running time-trial speed or time; • 0.4% in road-cycling time-trial time; • 0.3% in rowing-ergometer time-trial time; • 15% in time to exhaustion in a sub-VO2maximal constant-power test; • T/0.50% in time to exhaustion in a supra-VO2maximal constant-power test lasting T minutes; • 1% change in peak power in an incremental test, but… • >1% change in time to exhaustion in the test (but can usually recalculate to % change in power); • >1% change in power in any test following a pre-load (but sometimes can’t convert to % change in power in time trial). • Standardizing or Cohenizing of changes is a widespread but misused approach to turn effects into dimensionless units…
post pre strength 1.2-2.0large 2.0-4.0very large >4.0awesome <0.2trivial 0.2-0.6small 0.6-1.2moderate • To standardize, express the difference or change in the mean as a fraction of the between-subject SD (mean/SD). • But study samples are often drawn from populations with different SDs, so differences in effect size will be due partly to the differences in SDs. • Such differences are irrelevant and tend to mask interesting differences. • So meta-analyze a measure reflectingthe biological effect, such as % change. • Combine thepre-test SDs from the studies selectively and appropriately, to get one or more population SDs. • Express the meta-analyzed effect as a standardized effect using this/these SDs. • Use Hopkins’ modified Cohen scale to interpret the magnitude: Standardized change = 3.0 very large
Averaging effects from psychometric inventories • Recalculate effects after rescaling all measures to 0-100. • Standardize after meta-analysis, not before. • Averaging effects from counts (of injury, illness, death) • Best effect for such time-dependent events is the hazard ratio. • Hazard = instantaneous risk = proportion per small unit of time. • Proportional-hazards (Cox) regression is based on assumption that this ratio is independent of follow-up time. • Risk and odds ratios change with follow-up time, so convert any to hazard ratios. • Odds ratios from well-designed case-control studies are already hazard ratios. • If the condition is uncommon (odds or risks are <10% in both groups), risk and odds ratios can be treated as hazard ratios.
More weight for study-estimates with better precision • Usual weighting factor is 1/(standard error)2. • Equivalent to sample size, other things (errors of measurement) being equal. • Calculate from... • the confidence interval or limits • the test statistic(t, 2, F) • But F ratios with numerator degrees of freedom >1 can’t be used. • the p value • If "p<0.05"…, analyze as p=0.05. • If "p>0.05“, can’t use.
To get standard error for controlled trials, can also use… • SDs of change scores, • post-test SDs (but very often gives large standard error), • P values for each group, but not if one is p>0.05. DO NOT COMPARE STATISTICAL SIGNIFICANCEIN EXPERIMENTAL AND CONTROL GROUPS. • If none of the above are available for up to ~20% of study-estimates, assume a standard error of measurement to derive a standard error. • If can’t get standard error for >20% of study-estimates, use sample size as the weighting factor. • The factor is (study sample size)/(mean study sample size). • Equivalent to assuming dependent variable has same error of measurement in all studies. • For groups of unequal size n1 n2, use n = 4n1n2/(n1+n2). • Divide each study’s factor by the number of estimates it provided, to ensure equal contribution of all studies.
Adjustment for effects of study characteristics • Include as covariates in a meta-regression to try to account for differences in the effect between studies. Examples: • duration or dose of treatment; • method of measurement of dependent variable; • a score for study quality; • gender and mean characteristics of subjects (age, status…). • Treat separate outcomes for females and males from the same study as if they came from separate studies. • If gender effects aren’t shown separately in one or more studies, analyze gender as a proportion of one gender:e.g., for a study of 3 males and 7 females, “maleness” = 0.3. • Number of available study-estimates usually limits the analysis to main effects (i.e., no interactions). • Use a correlation matrix to identify collinearity problems.
Accounting for any clustering of study-estimates • Frequent clusters are several post tests in a controlled trial or different doses of a treatment in a crossover. • Treating each post test or dose as a separate study biases precision of the time or dose effect low and precision of all other effects high. • Fix with a mixed-model (= random-effect) meta-analysis. • Mixed modeling would also allow inclusion of effects in control and experimental groups as a cluster. • Current approach is to include only their difference… • …which doesn’t allow estimation of how much of the meta-analyzed effect is due to changes in the control groups.
Accounting for residual differences in study-estimates • There are always real differences in the effect between studies, even after adjustment for study characteristics. • Use random-effect meta-analysis to estimate the real differences as a standard deviation. • The mean effect ± this SD is what folks can expect typically from setting to setting. • For treatments, the effect on any specific individual will be more uncertain because of individual responses and measurement error. • Other random effects can account for any clustering. • A simple meta-analysis using sample size as the weighting factor is a random-effect meta-analysis.
Possible problems with Cochrane and RevMan • Comparison of subgroups and estimation of covariates • “Subgroup analyses can generate misleading recommendations about directions for future research that, if followed, would waste scarce resources.” • “No formal method is currently implemented in RevMan. When there are only two subgroups the overlap of the confidence intervals of the summary estimates in the two groups can be considered…” • Random-effects modeling • “In practice, the difference [between RevMan and more sophisticated random-effects modeling] is likely to be small unless there are few studies.” Really? • Forest and funnel plots • Some minor issues and suggestions for improvement.
This presentation will be available from: Wait for Sportscience 11, 2007, or contact will@clear.net.nz