1 / 9

12.8M

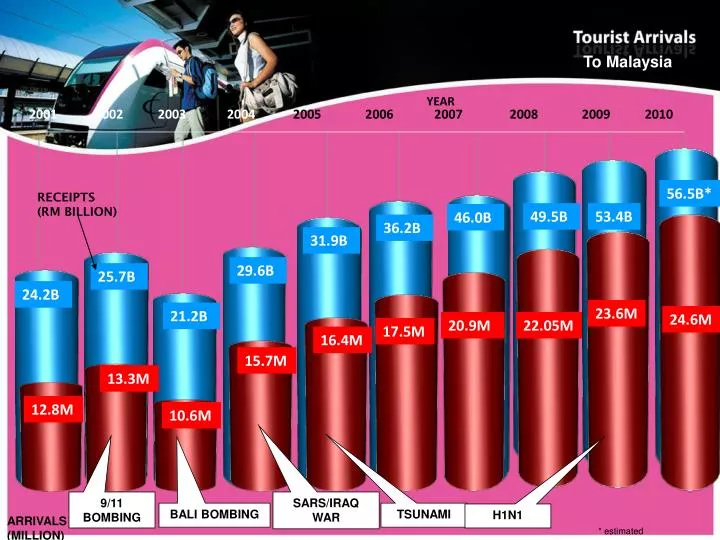
To Malaysia. YEAR. 2001 2002 2003 2004 2005 2006 2007 2008 2009 2010. 56.5B*. RECEIPTS (RM BILLION). 49.5B. 53.4B. 46.0B. 36.2B. 31.9B. 29.6B. 25.7B. 24.2B. 23.6M. 21.2B. 24.6M.

Download Presentation

12.8M

An Image/Link below is provided (as is) to download presentation Download Policy: Content on the Website is provided to you AS IS for your information and personal use and may not be sold / licensed / shared on other websites without getting consent from its author. Content is provided to you AS IS for your information and personal use only. Download presentation by click this link. While downloading, if for some reason you are not able to download a presentation, the publisher may have deleted the file from their server. During download, if you can't get a presentation, the file might be deleted by the publisher.

E N D

Presentation Transcript


  1. To Malaysia YEAR 2001 2002 20032004 2005 2006 2007 2008 2009 2010 56.5B* RECEIPTS (RM BILLION) 49.5B 53.4B 46.0B 36.2B 31.9B 29.6B 25.7B 24.2B 23.6M 21.2B 24.6M 20.9M 22.05M 17.5M 16.4M 15.7M 13.3M 12.8M 10.6M 9/11 BOMBING SARS/IRAQ WAR BALI BOMBING TSUNAMI H1N1 ARRIVALS (MILLION) * estimated

  2. January – December 2010 • Total Arrival 2010 = 24,577,196 • Total Arrival 2009 = 23,646,191 • Percentage Change = +3.9

  3. Key Tourism Indicators

  4. Tourist Arrival to Malaysia 2008 - 2010

  5. Tourist Arrival and Receipt

  6. Top Ten Tourist Arrival 2010

  7. Top Ten Tourist Receipt 2010

  8. Components of Tourism Expenditure 2010

  9. Hotel and Room Supply as at 2010

More Related