Download
1 / 13
150 likes | 430 Views
Half-life. Measuring the speed of radioactive decay. Why?. It can be difficult to determine the ages of objects by sight alone. e.g. It can be difficult to tell which students in a classroom are oldest.

E N D
Half-life Measuring the speed of radioactive decay
Why? • It can be difficult to determine the ages of objects by sight alone. • e.g. It can be difficult to tell which students in a classroom are oldest. • Radioactivity provides a method to determine age by comparing the relative amount of remaining radioactive material to the amount of stable products formed.
The Importance of Carbon Remember from our look at compounds, that most living organisms are based on organic molecules (i.e. contain carbon). Carbon has two main forms: a stable carbon-12 isotope and a radioactive isotope, carbon-14, and these exist naturally in a constant ratio. In nature, carbon-12 appears 98.9% of the time, while one carbon-14 atom appears for every 1 trillion normal atoms.
Carbon dating measures the ratio of carbon-12 and carbon-14. When an organism dies, carbon-14 stops being created and slowly decays. Measuring the relative amounts of carbon-12 : carbon-14 is called radiocarbon dating. What we find is that half of a sample of carbon-14 every 5730 years, regardless of the original size of the sample—this is the half-life of carbon-14. So radiocarbon dating can be used to provide the age of any organism or organic material… less than 50 000 years old (… more on why later!) Using radiocarbon dating, these cave paintings of horses, from France, were determined to have been drawn 30 000 years ago.
Half-life measure the rate of radioactive decay. • Half-life = time required for half of a radioactive sample to decay. • The half life for a radioactive element is a constant rate of decay. • e.g. Strontium-90 has a half-life of 29 years. If you have 10 g of strontium-90 today, there will be 5 g remaining in 29 years. • Half-lives of many common radioisotopes are listed on pg.12 of your data booklet.
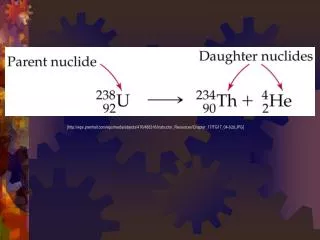
When using your table of radioisotopes you must consider: • Parent isotope = the original, radioactive material. • Daughter isotope = the stable product of the radioactive decay. • The rate of decay remains constant, but some elements require one step to decay, while others decay over many steps before reaching a stable daughter isotope. • Carbon-14 decays into nitrogen-14 in one step • Uranium-235 decays into lead-207 in fifteen steps. • Thorium-235 decays into lead-208 in ten steps.
25.0 g 50.0 g After 2nd half-life Example: Watch the decay of a50.0 g radioactive sample of C-14 After 1st half-life 12.5 g 6.25 g After 5th half-life 3.125 g After 3rd half-life After 4th half-life 1.625 g Remember: Every time a half-life passes half of a radioactive sample decays (i.e. is reduced by a half!)
Decay curves • Decay curves show the rate of decay for radioactive elements. • The curve shows the relationship between half-life and percentage of original substance remaining.
After 2nd half-life After 1st half-life Back to our Example… After 5th half-life After 4th half-life After 3rd half-life 12.5 6.25 3.125 1.625 25.0 50.0 25% 12.5% 6.25% 3.125% 50% 100%
Graphing our Example:Mass vs. Half-life Mass of Sample (g) Half-lives This type of graph is called an Exponential Decay graph--- it decreases very quickly to start with and approaches zero after a long time (~10 half-lives)
Graphing our Example:% Remaining vs. Time Percentage of Sample (%) Time (years) Notice: It doesn’t matter which method you use to plot the data, the shape of the curve is the same!
So why is C-14 dating only useful for samples less than 50000 years? Mass of Sample (g) Time (years) Note: After about 10 half-lives (for Carbon-14 approximately 50000 years) there is so little sample remaining that you cannot measure it accurately enough!
The Potassium-40 Clock • Radioisotopes with very long half-lives can help determine the age of very old things. • The potassium-40/argon-40 clock has a half-life of 1.3 billion years. • Argon-40 produced by the decay of potassium-40 becomes trapped in rock. • Ratio of potassium-40 : argon-40 shows age of rock.