Download
1 / 80
820 likes | 1.07k Views
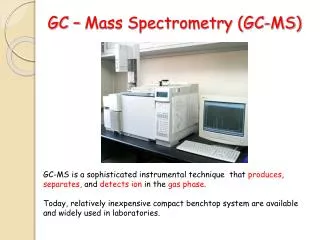
Evolution of Genomic GC-content. Laurent Duret Laboratoire de Biométrie et Biologie Evolutive, CNRS, Université Lyon 1. Evolution of Genomic GC-content. Evolution ary Genomics : recombination clouds the clues. Laurent Duret

E N D
Evolution of GenomicGC-content Laurent Duret Laboratoire de Biométrie et Biologie Evolutive, CNRS, Université Lyon 1
EvolutionaryGenomics: recombinationclouds the clues Laurent Duret Laboratoire de Biométrie et Biologie Evolutive, CNRS, Université Lyon 1
EvolutionaryGenomics • Genomics: what are the goals of genome sequencing projects? • What's the interest of studying genome evolution?
EvolutionaryGenomics (1): Understand the evolution of life • Genomes contain traces of their own history • Analyze genome sequences to study: • The origin of life • The phylogeny of species, history of populations • The adaptation of species to their environments (including their competitors, host/pathogens interactions) • The evolution of the environment • …
EvolutionaryGenomics (2): Understand genome content and organization • « Nothing in BiologyMakesSenseExcept in the Light of Evolution »(T. Dobzhansky, 1973) • Genomes are the result of millions of years of evolution; present-day sequences reflect the evolutionary forces (mutation, selection, drift, …) that affect genomes or that had affected them in the past • If we want to understand (decipher) genomic sequences, we have to understand how they have evolved
Evolutionary Genomics (3): Evolution as a natural experimental laboratory • Many of the mutagenesis experiments one would like to achieve, have already been tested in nature • Genome annotation by comparative genomics: • Functional elements constrained by naturalselection • Search for the signature of selectionwithingenomes => identifyfunctionalelements
EvolutionaryGenomics • We need to understand the processes that drive genome evolution … • … to be able to reconstruct the evolution of life • … to understand the content and functioning of genomes • Molecular mechanisms + population processes
Evolution • Mutation => new alleles • Changes of allelefrequenciesover generations Population • Natural selection • Geneticdrift Generations Substitution … Fixation of the red allele
Last Names Duret Arndt Galtier EyreWalker Arndt Galtier Arndt EyreWalker Galtier Galtier Galtier Galtier Courtesy: Adam Eyre-Walker
Evolution : mutation, selection, drift Probability of fixation: p = f(s, Ne) s : relative impact on fitness s = 0 : neutral mutation (randomgenetic drift) s < 0 : disadvantageous mutation = negative (purifying) selection s > 0 : advantageous mutation = positive (directional) selection Ne : effective population size: stochasticeffects of gametesampling are stronger in small populations |Nes| < 1 : effectivelyneutral mutation
Probability of Fixation Duret Arndt Galtier EyreWalker Arndt Galtier Arndt EyreWalker Galtier Galtier Galtier Galtier Probability of fixation = 1/N = 1/4 Courtesy: Adam Eyre-Walker
Mutation Rate Doret Arndt Galtiex EyreWalker Arnds Galtiex Arndt EyreWalker Galtiex Galtier Galtiex Galtiex Number of Mutations in the Pop = uN = 1/5 x 4 = 0.8
Neutral Rate Population size = N = 4 Rate of mutation (per generation) = u = 1/5 Number of mutations in the population (per generation) = uN = 4/5 Probability of fixation = 1/N = 1/4 Rate of substitution = uN x 1/N = u = 1/5 Courtesy: Adam Eyre-Walker
Trackingnaturalselection ... • Demonstrate the action of selection = reject the predictions of the neutral model • Compare substitution rate (K) to mutation rate (u) : • Neutralevolution => K = u • Negativeselection => K < u • Positive selection => K > u Protein-codinggenes: Non-synonymous substitution rate: dN Synonymous substitution rate: dS ≈ u
Searching for functional sequences under negative (purifying) selective pressure:Phylogenetic Footprints • Comparative genomics: when comparing sequences from different species, the mutations that are not observed are the ones that are deleterious (the others are neutral or beneficial)
Comparison of human and mouse genomes (MGSC 2002) • Alignment of human and mouse genomes : 40% of the humangenomecanbealignedwith the mouse genome • How much of the humangenomeisundernegativeselective pressure ??
Comparison of human and mouse genomes Distribution of substitution rates AncientRepeats(neutral marker) Non-repeatedsequences Probability to beundernegativeselective pressure • More than 5% of the genome of mammalsisundernegativeselection • NB: only 1.0% du genomeiscoding !! 4 times more functionalnon-codingregionsthancodingregions !! MGSC (Nature, 2002)
Phylogenetic footprints = genetic conservatism • Phylogeneticfootprints = functionalelementsconservedduringevolution • What about sequenceelementsthat have been involved in functional innovation ? • Whatare the functionalelementsresponsible for adaptative evolution ?
What make chimps different from us ? • Searching for functionalelementssubject to positive (directional) selection: substitution rate > u • => search for geneswithelevateddN/dS 30 x106 point substitutions + indels + duplications (copy number variations)
Tracking natural selection ... by analysis of polymorphism data • Derived allele frequency spectrum Neutral sites Negativelyselected sites Positivelyselected sites 0.35 0.25 Proportion of SNPs 0.15 0.05 10% 20% 30% 40% 50% 60% 70% 80% 90% <100% Derived Allele Frequency
Tracking natural selection ... by analysis of polymorphism data • Derived allele frequency spectrum Neutral sites Negatively selected sites Positively selected sites 0.35 0.25 Proportion of SNPs 0.15 0.05 10% 20% 30% 40% 50% 60% 70% 80% 90% <100% Derived Allele Frequency
Tracking natural selection ... by analysis of polymorphism data • Derived allele frequency spectrum Neutral sites Negatively selected sites Positively selected sites 0.35 0.25 Proportion of SNPs 0.15 0.05 10% 20% 30% 40% 50% 60% 70% 80% 90% <100% Derived Allele Frequency
Evolution • Mutation => new alleles • Changes of allelefrequenciesover generations Population • Natural selection • Genetic drift • Biasedgene conversion Generations … Fixation of the red allele
Biased Gene Conversion (BGC) Molecular events of meiotic recombination BGC increases the frequency of the donoralleles in the pool of gametes => increasestheirprobability of fixation in populations BGC: a non-adaptiveprocessthat looks likeselection T Heteroduplex G DNA DNA mismatch (T C) -> (G -> A) repair T C A G Non-crossover C rossover
In yeast, BGC favors GC alleles over AT alleles • Mancera et al. (Nature 2008): highresolutionmapping of meioticrecombinationproducts in yeast • >6000 recombinationevents • Gene conversion tracts involving GC/AT heterozygotes • Gametefrequencyexpected in absence of BGC: freq. GC = freq. AT = 50% • Observedgametefrequency: freq. GC=50.7% AT=49.3% => BGC increases the frequency of GC allelesin populations => increasestheirprobabilityof fixation
Does BGC affectgenomeevolution in mammals? • Relationship between substitution patterns and recombinationrate ? • Analysis of (nearly) neutral sites
Substitution patterns in the primate lineage • Human, chimp, macaca whole genome alignments: • 2700 Mb (98% introns and intergenic regions) • Substitution rates: A C G T In collaboration with Peter Arndt (Berlin)
Base composition expected at equilibrium (GC*) • Equilibrium GC-content : the GC content that sequences would reach if the pattern of substitution remained constant over time = the future of GC-content • Inferred from the rates of substitutions observed in human/chimp lineages • Summary statistics of the substitution pattern
Equilibrium GC-content and recombination R2 = 36% p < 0.0001 60% Equilibrium GC-content GC* 50% 40% 30% Cross-Over Rate (cM/Mb) 0 1 2 3 4 5 6 7 8 9 N = 2707 non-overlapping windows (1 Mb), from autosomes Duret & Arndt (2008) Plos Genet
GC-content and Recombination • Strong correlation: suggests direct causal relationship • GC-rich sequences promote recombination ? • Gerton et al. (2000), Petes & Merker (2002), Spencer et al. (2006) • Recombination promotes ATGC substitutions ?
GC-content and recombination 70% N = 2707 R2 = 14% p < 0.001 60% Present GC-content 50% 40% 0 1 2 3 4 5 6 7 8 9 Cross-Over Rate (cM/Mb)
Substitution pattern and recombination in primates R2 = 36% p < 0.0001 60% Equilibrium GC-content GC* 50% 40% 30% Cross-Over Rate (cM/Mb) • Male cross-over rate: R2 = 31% • Female cross-over rate: R2 = 15% 0 1 2 3 4 5 6 7 8 9 N = 2707 non-overlapping windows (1 Mb, non-coding regions), from autosomes Duret & Arndt (2008) Plos Genet
Mutation or BGC ? • Model 1: BGC in favor of GC-alleles • Recombinationincreases the probability of fixation of GC-alleles • Model 2: Mutation • Recombinationincreases the rate of mutation ATGC and/or decreasesGCAT (but does not affect theirprobability of fixation) • Compare the frequencyspectrum of SNPssegregating in human populations Eyre-Walker (1999), Duret et al. (2002),Lercher et al. (2002), Spencer et al. (2006)
Derivedallelefrequency (DAF) spectrum: intergenic regions Difference = d High recombination Eyre-Walker (1999), Duret et al. (2002),Lercher et al. (2002), Spencer et al. (2006) => Fixation bias in favor of GC-alleles N=498,318 SNPs, from HapMap (YRI). p < 10-3
The fixation bias in favor of GC-allelesincreaseswithrecombination d N=2,900,000 SNPsfrom introns and intergenic regions in autosomes (HapMap). Local crossover rate (5kb) from HapMap Mean DAF Crossover rate, cM/Mb (Log scale)
Mutation or BGC ? • GC-allelessegregateathigherfrequencythanAT-alleles • => not compatible with the mutational model • This fixation biasincreaseswithrecombinationrate • => BGC in favor of GC-alleles • Direct evidence in yeast (Mancera et al. 2008)
BGC or selection? • Hyp.: selection on genomicGC-content => GC-alleles have a higherprobability of fixation • Whatwouldbe the selectiveadvantage? Whyshoulditvaryalong the genome? • This model does not predict the strongcorrelationsobservedbetweenrecombination and GC* or DAF • This model wouldimply a hugemutationalload (100% of the genomeunderselective pressure!)
BGC can affect functional regions • Fxy gene : translocated in the pseudoautosomal region (PAR) of the X chromosome in Mus musculus X specific PAR Recombination rate normal extreme GC synonymous sites normal very high (55%) (90%)
5’ part of Fxy : 4 3’ part of Fxy : 5 2 1 1 0 0 3 1 1 0 X X Y Y PAR PAR Amino-acid substitutions in Fxy 80 60 Time (Myrs) 40 20 28 0 Homo Rattus M. spretus M. musculus
5’ part of Fxy : 4 3’ part of Fxy : 5 2 1 1 0 0 3 1 1 0 Amino-acid substitutions in Fxy 80 60 Time (Myrs) 40 20 28 0 Homo Rattus M. spretus M. musculus 28 non-synonymous substitutions, all ATGC Acceleration: x 327 NB: strongnegativeselection
Is Fxy just an exception? Is gBGC strongenough in otherregions of the genome to affect the spreading of deleterious mutations?
Does gBGC affect the fate of deleterious mutations in extanthuman populations?
DAF spectrum: non-synonymousSNPs High recombination N=4,975 SNPs, from HapMap (YRI). p < 10-3
DAF spectrum: probablydamagingnon-synonymousSNPs High recombination Polyphenpredictions N=351 SNPs, from HapMap (YRI). p = 10-3
DAF spectrum: mutations involved in geneticdiseases • HGMD database High recombination N=169 HGMD mutations present in HapMap (YRI). p < 10-3
The fixation bias in favor of GC-alleleincreaseswithrecombination
Summary • Non-synonymous ATGC mutations segregateathigherfrequencythan GCAT mutations in regions of highrecombination • This pattern isobserved for all SNPs, includingthosethat are involved in geneticdiseases • => gBGC favors the spreading of deleterious ATGC mutations