Download
1 / 11
110 likes | 267 Views
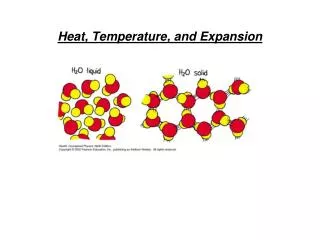
From Cloud Top Temperature to Rainfall; Blending MSG and TRMM. Ben Maathuis Department of Water Resources ITC-Enschede The Netherlands. From temperature to rainfall (1).

E N D
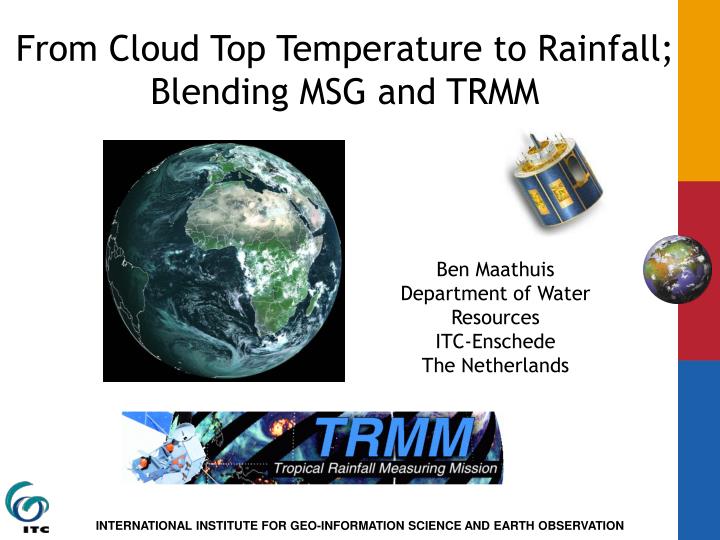
From Cloud Top Temperature to Rainfall; Blending MSG and TRMM Ben Maathuis Department of Water Resources ITC-Enschede The Netherlands
From temperature to rainfall (1) • Use TRMM to calibrate Meteosat Cloud Top Temperature (10.8 micron band) and transform a time series of MSG images into Precipitation.
From temperature to rainfall (2) • View TRMM data using Orbit Viewer and select area, export data to lat/long/rainfall intensity table Available from http://tsdis.gsfc.nasa.gov
From temperature to rainfall (3) • Import time series of MSG data using the MSG Data Retriever, converted to TOA Temperature Some Key-features: • Based on open source GDAL drivers; • Fully controlled geometry & radiometry, conversions to diff. data formats: DN, radiances, reflectance, temperature; • Diff. user defined output formats and resolutions (interpolation); • Easy date/time range selection and series construction.
From temperature to rainfall (4) • Import of tabular TRMM observations, linking the point map and corresponding MSG image using ILWIS • Large number of TRMM rainfall observations
From temperature to rainfall (5) • Low correlation due to spatial and temporal offsets when aligning geostationary IR and LEO PMW datasets on a per-pixel basis; • Improvement of correlation by averaging procedure. After: “Validation of an operational global precipitation analysis at short time scales”. By: F. Joseph Turk, et al Marine Meteorology Division, Naval Research Laboratory, Monterey, California 93943
From temperature to rainfall (6) • TRMM rainfall pixels are averaged based on MSG–IR temperature class intervals (in classes of 0.5 or 1 degree K) to obtain for a temperature range (e.g. from 180 to 260 Kelvin) for each temperature class the average corresponding rainfall intensity
From temperature to rainfall (7) • Develop an improved relationship between averaged rainfall intensity and temperature
From temperature to rainfall (8) • Transform temperature time series to rainfall by single statement rain08sept:=maplistapplic(t_200509080000_ir_108.mpl, "iff((##)<260,4.3505278e-005*(exp(2550.0127/(##))),0)") Can also be displayed as animation
From temperature to rainfall (9) • Rainfall per time step • Accumulated 24 hour rainfall
Conclusion • TRMM observations can be used for MSG-IR calibration after an averaging procedure but needs better cloud mask and type determination; • For validation synoptic station data has to be used (at appropriate temporal resolution -> tipping bucket); • Low cost ground receiving station and free software sources make such a near real-time system suitable for e.g. National Hydrological Services and Basin Authorities; • Especially suitable for short duration rainfall events, e.g. for flash floods.