Download
1 / 1
10 likes | 133 Views
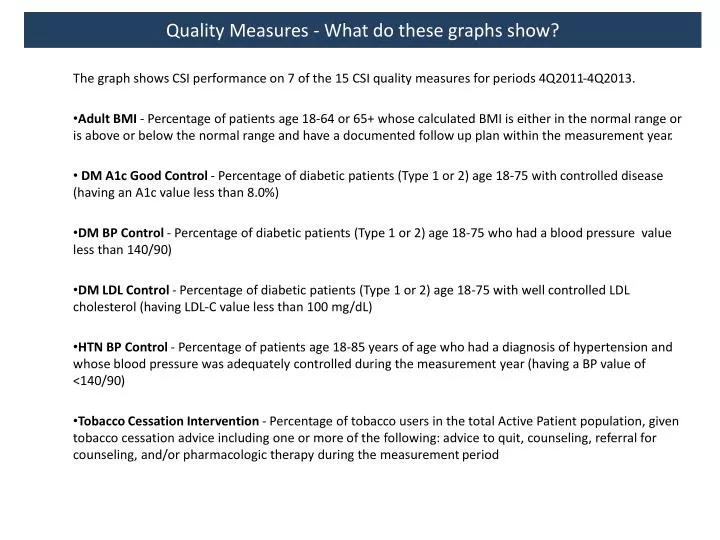
Quality Measures - What do t hese graphs show?. The graph shows CSI performance on 7 of the 15 CSI quality measures for periods 4Q2011-4Q2013.

E N D
Quality Measures - What do these graphs show? The graph shows CSI performance on 7 of the 15 CSI quality measures for periods 4Q2011-4Q2013. Adult BMI - Percentage of patients age 18-64 or 65+ whose calculated BMI is either in the normal range or is above or below the normal range and have a documented follow up plan within the measurement year. DM A1c Good Control - Percentage of diabetic patients (Type 1 or 2) age 18-75 with controlled disease (having an A1c value less than 8.0%) DM BP Control - Percentage of diabetic patients (Type 1 or 2) age 18-75 who had a blood pressure value less than 140/90) DM LDL Control - Percentage of diabetic patients (Type 1 or 2) age 18-75 with well controlled LDL cholesterol (having LDL-C value less than 100 mg/dL) HTN BP Control - Percentage of patients age 18-85 years of age who had a diagnosis of hypertension and whose blood pressure was adequately controlled during the measurement year (having a BP value of <140/90) Tobacco Cessation Intervention - Percentage of tobacco users in the total Active Patient population, given tobacco cessation advice including one or more of the following: advice to quit, counseling, referral for counseling, and/or pharmacologic therapy during the measurement period