Download
1 / 15
150 likes | 234 Views
Comparisons of phytoplankton community characteristics at different chlorophyll concentrations: “Are we seeing a shift in algal community structure?” discrete (10 µg/L bins) 0-10, 10-20, 20-30, 30-40, 40-50, 50-60, 60-70, 70-80, 80-90, 90-100, >100 ANOVA, multiple comparison post-hoc test

E N D
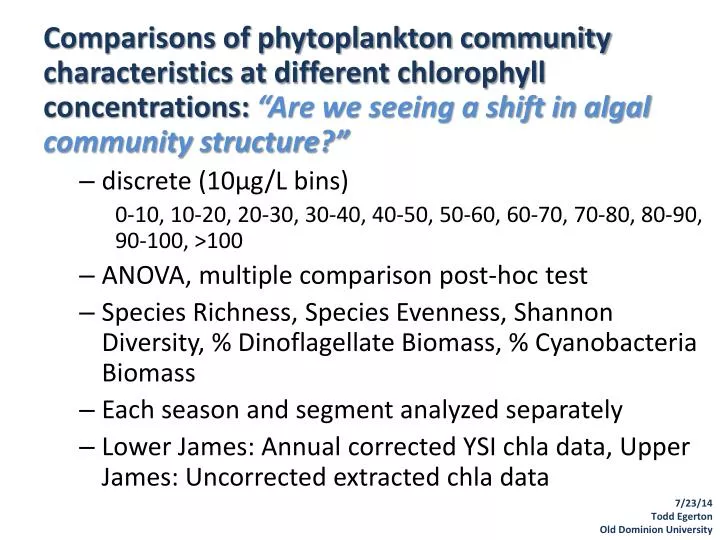
Comparisons of phytoplankton community characteristics at different chlorophyll concentrations: “Are we seeing a shift in algal community structure?” • discrete (10µg/L bins) 0-10, 10-20, 20-30, 30-40, 40-50, 50-60, 60-70, 70-80, 80-90, 90-100, >100 • ANOVA, multiple comparison post-hoc test • Species Richness, Species Evenness, Shannon Diversity, % Dinoflagellate Biomass, % Cyanobacteria Biomass • Each season and segment analyzed separately • Lower James: Annual corrected YSI chladata, Upper James: Uncorrected extracted chla data 7/23/14 Todd Egerton Old Dominion University
Phytoplankton community characteristics: Segment: JMSMH Years: 2011-2013 ANOVA/REGWF Spring (March-May) ANOVA P<0.000 ANOVA P<0.000 ANOVA P<0.000 Summer (July-August) N.S.: Species Richness, % Cyano A A ANOVA P<0.000 ANOVA P<0.000 ANOVA P<0.000 AB ABC ABC BC BC C C C 7/23/14 Todd Egerton Old Dominion University
Comparisons of exceeding HAB thresholds at different chlorophyll concentrations: “What proportion of samples within a given Chla range exceed a HAB density of concern?” 7/23/14 Todd Egerton Old Dominion University
Comparisons of exceeding HAB thresholds at different chlorophyll concentrations: “What proportion of samples within a given Chla range exceed a HAB density of concern?” (Wood and Bukaveckas) Chla bins (10µg/L) x likelihood of impairment (proportion of collections when microcystin exceeds a threshold). Microcystin concentrations based on Rangiabioassays Question: test of significance? 7/23/14 Todd Egerton Old Dominion University
Comparisons of exceeding HAB thresholds at different chlorophyll concentrations: “What proportion of samples within a given Chla range exceed a HAB density of concern?” • Cochlodinium polykrikoides • Example thresholds: presence (>10/ml), 1000 cells/ml, 3000 cells/ml, 6000 cells/ml, 12,000 cells/ml • discrete (10µg/L bins) 0-10, 10-20, 20-30, 30-40, 40-50, 50-60, 60-70, 70-80, 80-90, 90-100, >100 • Percentage of samples within each Chla bin with C. polykrikoides densities exceeding thresholds • 2011-2013, summer season, by segment 7/23/14 Todd Egerton Old Dominion University
Cochlodinium polykrikoides thresholds Season: summer (July-August) Years: 2011-2013 Segments: JMSMH n=165 7/23/14 Todd Egerton Old Dominion University
Cochlodinium polykrikoides thresholds Season: summer (July-August) Years: 2011-2013 Segments: JMSPH n=78 7/23/14 Todd Egerton Old Dominion University
Cochlodinium polykrikoides thresholds Season: summer (July-August) Years: 2011-2013 Segments: ER n=98 7/23/14 Todd Egerton Old Dominion University
Cochlodinium polykrikoides thresholds Season: summer (July-August) Years: 2011-2013 Segments: LAF n=105 7/23/14 Todd Egerton Old Dominion University
Cochlodinium polykrikoides thresholds Season: summer (July-August) Years: 2011-2013 Segments: JMSMH, JMSPH, ER & LAF n=446 7/23/14 Todd Egerton Old Dominion University
Cochlodinium polykrikoides thresholds Season: summer (July-August) Years: separate Segments: JMSMH, JMSPH, ER & LAF ?tbd 2014 7/23/14 Todd Egerton Old Dominion University
Chla to Cochlodinium abundance • All Summer season data, all lower James segments, 2011-2013 • Chla>400 excluded • Sig. positive relationships between Chla and C. polykrikoides densities each year…. • But: different relationships/regressions • 2012 and 2013 similar • If ‘concern levels’ are >5000 cells/ml, 2011 data shouldn’t be used due to lower bloom densities? 7/23/14 Todd Egerton Old Dominion University
Chla to Cochlodinium abundance • 2012-2013 data merged • Summer (July-September) • JMSMH,JMSPH, LAF, ER • N=301 • p<0.000, R2=0.64 • Linear Regression Y= C. polykrikoides abundance (cells/ml) X= Chlaµg /L(annual correction) Y=87.204x-753.91 7/23/14 Todd Egerton Old Dominion University
Chla to Cochlodinium abundance • 2012-2013 data merged • Summer (July-September) • JMSMH,JMSPH, LAF, ER • N=301 • p<0.000, R2=0.64 • Linear Regression Y= C. polykrikoides abundance X= corrected Chla(annual) Y=87.204x-753.91 10 cells/ml = 8.8µg Chla/L 1000 cells/ml =20.1 Chla/L 3000 cells/ml = 43.0 µg Chla/L 6000 cells/ml = 77.4 µg Chla/L 12,000 cells/ml = 146.3 µg Chla/L 7/23/14 Todd Egerton Old Dominion University
Next steps • Finalize HAB density threshold(s) • Algal community structure analysis for each segment/season • Additional HAB species (Microcystis aeruginosa in JMSTF) • 2014 Cochlodinium data (increase confidence in Chla relationship) • IBI calculation and analyses • Moving beyond discrete binned analysis: • Changepoint analysis, correlation/regression, PCA, multivariate (ANOSIM, PERMANOVA) 7/23/14 Todd Egerton Old Dominion University