Download
1 / 16
160 likes | 264 Views
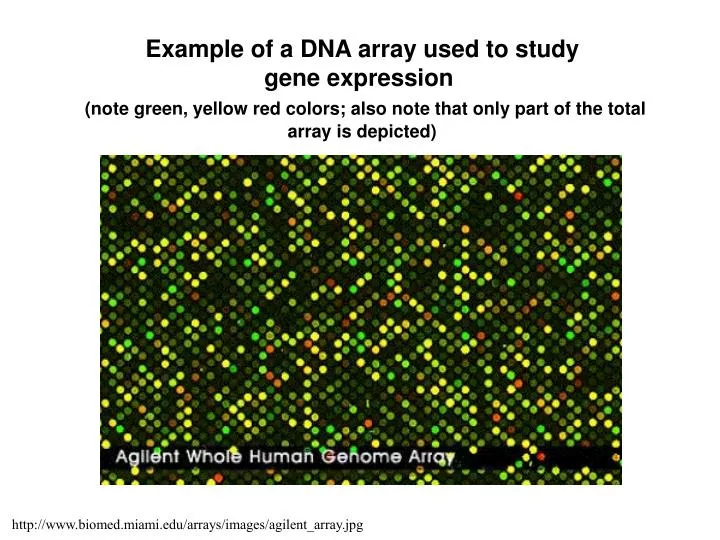
Example of a DNA array used to study gene expression (note green, yellow red colors; also note that only part of the total array is depicted). http://www.biomed.miami.edu/arrays/images/agilent_array.jpg. DNA Arrays: Two Purposes. Genotype individuals on polymorphisms (read text for example).

E N D
Example of a DNA array used to studygene expression (note green, yellow red colors; also note that only part of the totalarray is depicted) http://www.biomed.miami.edu/arrays/images/agilent_array.jpg
DNA Arrays: Two Purposes Genotype individuals on polymorphisms(read text for example). Study gene expression (these slides).
Methods:Studying Gene Expression Step 1: Create a DNA array (gene “chip”) by placing single-stranded DNA for each gene to be assayed into a separate “well” on the chip.
cDNAgene 1 cDNAgene 2 cDNAgene 3 cDNAgene 4 cDNAgene 5 DNA Array: Single-stranded copy DNA foreach gene in a different well.
Methods:Studying Gene Expression Step 2: Extract mRNA from biological tissues subjected to an experimental treatment and from the same tissue subjected to a control treatment. Step 3: Make single-stranded DNA from the mRNA using “color coded” nucleotides.
Extract mRNA from Control Cells Extract mRNA from Experimental Cells Make single-stranded cDNA using green nucleotides Make single-stranded cDNA using red nucleotides cDNA = complementary DNA (DNA synthesized from RNA)
Methods:Studying Gene Expression Step 4: After making many DNA copies of the RNA, extract an equal amount of cDNA from the controls & experimentals and place it into a separate container.
Control cDNA Experimental cDNA
Methods:Studying Gene Expression Step 5: Extract a smallamount in a pipette.
Methods: Step 6: Insert into first well.
Methods: Step 7: Extractmore cDNA and … … insert intosecond well, etc.
Methods: Step 8ff: Continue until all wells arefilled.
Methods: Step 9: Allow to hybridize, then wash away all single-stranded DNA.
Result: Some wells have no color-coded cDNA (no mRNA in either type of cell) Some wells have only red (i.e., expressed only in experimental cells) Some wells have only green (i.e., expressed only in control cells) Some wells have both red and green in various mixtures (expressedin both experimental and control cells)
Methods: Step 10: Scan with a laser set to detect the color & process results on computer.
Only in controlcells Mostly in controlcells Mostly in experimentalcells Only in experimentalcells Same inboth cells Results: The colors denote the degree of expression in the experimental versus the control cells. Gene not expressed in control or in experimental cells