Download
1 / 23
230 likes | 362 Views
Paired-Sample Hypotheses. -Two sample t-test assumes samples are independent -Means that no datum in sample 1 in any way associated with any specific datum in sample 2 -Not always true. Ex: Are the left fore and hind limbs of deer equal?

E N D
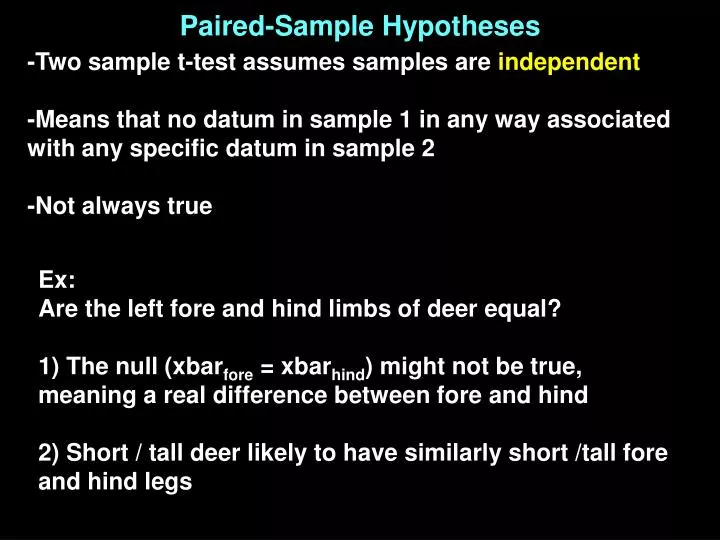
Paired-Sample Hypotheses -Two sample t-test assumes samples are independent -Means that no datum in sample 1 in any way associated with any specific datum in sample 2 -Not always true Ex: Are the left fore and hind limbs of deer equal? 1) The null (xbarfore = xbarhind) might not be true, meaning a real difference between fore and hind 2) Short / tall deer likely to have similarly short /tall fore and hind legs
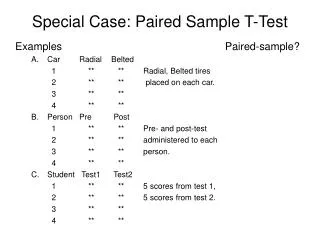
Examples of paired means NPP on sand and rock from a group of mesocosms Rock NPP Sand NPP *******Will give code later, you can try if you want
Examples of paired means Do the scores from the first and second exams in a class differ? Paired by student. More……..
Don’t use original mean, but the difference within each pair of measurements and the SE of those differences mean difference d t = t = s d SE of differences - Essentially a one sample t-test - = n-1
Paired-Sample t-tests • Can be one or two sided • Requires that each datum in one sample correlated with only one datum in the other sample • Assumes that the differences come from a normally distributed population of differences • If there is pariwise correlation of data, the paired-sample t-test will be more powerful than the “regular” t- test • If there is no correlation then the unpaired test will be more powerful
-Example code for paired test -make sure they line up by appropriate pairing unit data start; infile ‘your path and filename.csv' dlm=',' DSD; input tank $ light $ ZM $ P $ Invert $ rockNPP sandNPP; options ls=100; procprint; data one; set start; procttest; paired rockNPP*sandNPP; run;
Power and sample sizes of t-tests To calculate needed sample size you must know: significance level (alpha) power surmised effect (difference) variability a priori To calculate the power of a test you must know: significance level (alpha) surmised effect (difference) variability sample size a priori or retrospective See sections 7.5-7.6 in Zar, Biostatistical Analysis for references
Power and sample sizes of t-tests To estimate n required to find a difference, you need: -- , frequency of type I error -- , frequency of type II error; power = 1- -- , the minimum difference you want to find --s2, the sample variance Only one variable can be missing s2 (t(1or2),df + t (1)df)2 n= 2 But you don’t know these Because you don’t know n!
--Iterative process. Start with a guess and continue with additional guesses, when doing by hand Or --tricky let computer do the work SAS or many on-line calculators demo -- need good estimate of s2 Where should this come from?
Example: weight change (g) in rats that were forced to exercise Data: 1.7, 0.7, -0.4, -1.8, 0.2, 0.9, -1.2, -0.9, -1.8, -1.4,-1.8,-2.0 Mean= -0.65g --s2=1.5682 --Find diff of 1g --90% chance of detecting difference (power) power=1- = 0.1 (always 1 sided) --=0.05, two sided Start with guess that N must =20, df=19
s2 (t(1or2),df + t (1)df)2 n= 2 2 tailed here, but could be one tailed 1.5682 (tcritical 0.05 for df=19 + tcritical 0.1 for df=19)2 n= (1)2 always one tailed 1.5682 (2.09 + 1.328)2 n= (1)2 n= 1.5682 * (3.418)2 n= 18.3 Can repeat with df= 18 etc…….
Difference you want to detect Calc from variance to use other “analyst” functions must have read in data set
Increase minimum difference you care about, n goes down. Easier to detect big difference
Very useful in planning experiments- even if you don’t have exact values for variance….. Can give ballpark estimates (or at least make you think about it)
Calculate power (probability of correctly rejecting false null) for t-test - t (1or2),df t (1)df = s2 n --Take this value from t table
Back to the exercising rats……. Data: 1.7, 0.7, -0.4, -1.8, 0.2, 0.9, -1.2, -0.9, -1.8, -1.4,-1.8,-2.0 Mean= -0.65g --s2=1.5682 N=12 What is the probability of finding a true difference of at lease 1g in this example?
- t (1or2),df t (1)df = s2 n 1 t (1)11 = 1.5682 - 2.201 12 t (1)11 = 2.766- 2.201 t (1)11 = 0.57
Find the closest value, is approximate because table not “fine grained” df = 11 If > 0.25, then power < 0.75
--Can use SAS Analyst and many other packages (e.g. JMP,………) to calculate more exact power values --For more complicated designs….. Seek professional advise!