Download
1 / 24
260 likes | 488 Views
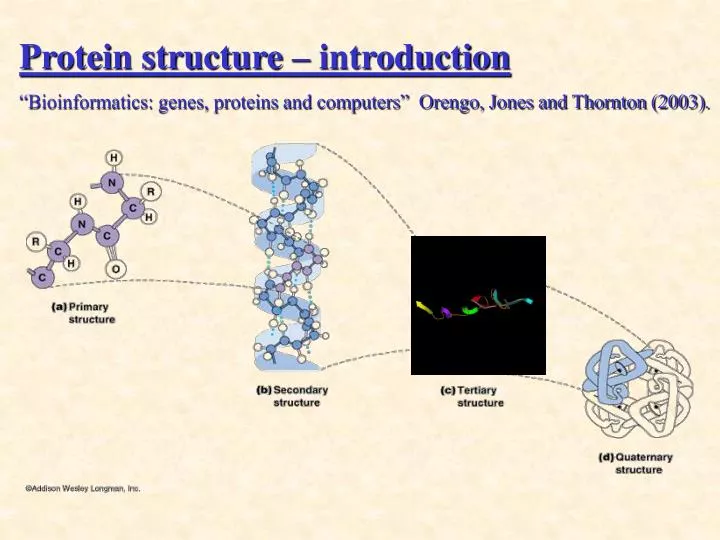
Protein structure – introduction “Bioinformatics: genes, proteins and computers” Orengo, Jones and Thornton (2003). a - helix. - strand b - sheet. Secondary structure elements. Tertiary structure = protein fold. complete 3-dimensional structure.

E N D
Protein structure – introduction “Bioinformatics: genes, proteins and computers” Orengo, Jones and Thornton (2003).
a-helix • -strand b-sheet Secondary structure elements
Tertiary structure = protein fold complete 3-dimensional structure why is it interesting? isn’t the sequence enough? • the structure is more conserved! • detection of distant evolutionary relationships • a key to understand protein function • Structure-based drug design
Fold classification classification: clustering proteins into structural families motivation? • profound analysis of evolutionary mechanisms • constraints on secondary structure packing? • classification at domain level
CATH – Protein Structure Classification • hierarchical classification of protein domain structures in the Brookhaven Protein Databank (PDB). • domains are clustered at four major levels: • Class • Architecture • Topology • Homologous superfamily • Sequence family
CATH – hierarchical classification • Classsecondary structure content: mainly a,mainly b,a – b, low 2nd structure content. • Architecturegross orientation of secondary structures, independent of connectivity. • Topology ( = fold)clusters structures according to their topological connections.
CATH – hierarchical classification • Homologous superfamily • homologous domains identified by sequence similarity, and structure similarity • Sequence family • domains clustered in the same sequence families, with sequence identity>35% • other classification schemes: SCOP, FSSP partial disagreement between them.
GenBank contains 24,027,936 sequences! Growing demand for protein structures! • PDB contains 20,868 structures • X-Ray and NMR have limitations. WE NEED FASTER METHODS!
protein sequence: RGYSLGNWVC KVFGRCELAA AMKRHGLDNY AAKFESNFNT QATNRNTDGS TDYGILQINS RWWCNDGRTP GSRNLCNIPC SALLSSDITA SVNCAKKIVS DGNGMNAWVA WRNRCKGTDV I)Ab initio = ‘from the beginning’ - Simulation (physics) - search for conformation with lowest energy - Knowledge-based (i.e. statistics) Protein Structure Prediction • Limited to very short peptides!
PDB inspection: a ‘new’ protein has a good chance to be of a known structure! Total of "new folds" (light blue) and "old folds" (orange) for a given year Can known structures assist prediction? the number of possible folds seems to be limited! • CATH inspection: more then 36,000 domains, but... only ~800 topology groups
Template-based prediction (fold recognition) II) Comparative modeling (homology modeling) - alignment with homologous sequence of known structure. - high sequence identity areas: similar structure - variable areas: must be built • can’t be used if no sequence similarity found! III) Threading - alignmentwith structure sequences in fold library - sophisticated scoring function finds most similar fold - ‘Threading’ aligns target sequence onto template structure
“What are the baselines for protein fold recognition?” McGuffin, Bryson and Jones (2001) • Goals: • what constitutes a baseline level of success for protein • fold recognition methods, above random guesswork? 2. can simple methods that make use of 2nd structure information assign folds more reliably? • how valuable might these methods be in the rapid • construction of a useful hierarchical classification?
1. Absolute difference in length 2. Absolute difference in number of secondary structure elements 3. Simple alignment of secondary structure elements 4. Alignment of secondary structure elements (Przytycka et al., 1999) 5. Alignment of secondary structure elements without additional scoring 6. Alignment of secondary structure elements using DSSP as secondary structure assignment 7. Alignment of secondary structure elements with gap penalty 8. Alignment of secondary structure elements with gap penalty for long elements 9. Alignment of secondary structure elements with absolute difference in length as scoring scheme 10. Alignment of full length secondary structure strings 11. Alignment of primary sequence The methods evaluated (ordered by complexity and runtime) • shorten 2nd structure strings:CCCHHHHCCCEEECCHHHCCC HCECH. • pairwise alignment • scoring function also considers length of elements
A representative set of protein domains • a set of 1087 domains representing different “Sequence Families” was selected from CATH. • generate an informative file for each domain: 1. >1atx00 2. GAAaLbKSDGPNTRGNSMSGTIWVFGcPSGWNNbEGRAIIGYacKQ 3. EEE TTS S TTSSEEEEEESS TT EEE SSSSSEEEE 4. CEEEEEHHECEEEECCCECEEEECCCEECCEECEEECCEECEEEEC
Sort each score list by descending similarity score. (a,d) 0.99 (g,e) 0.98 (r,s) 0.87 | (a,b) 0.63 (k,f) 0.45 (g,d) 0.37 CATH (a) = CATH (d) • lets assume there are • 100 structurly similar pairs • And 100 dissimilar pairs CATH (g) != CATH (e) CATH (r) = CATH (s) 0 true counter = CATH (k) != CATH (f) CATH (a) != CATH (b) 0 false counter = for each list: go top downward, and compare assignment to CATH First evaluation: true positive percentage compare true positive percentage, at a fixed 3% false positive. run each methodon all possible pairs from the 1087 set (a,b) (a,c) (a,d) ... (g,d) (g,e) ... (k,f) ... (r,s) .... ~590,000 pairs STOP! 3% false positives reached. true positive for this method = 2% 1 2 2 1 3
upper control: automated recognition (given the 3D structure) • FSSP, SCOP and CATH databases were screened for all dissimilar domains that exist in the three of them. • FSSP gave similarity scores to all possible pairs. • FSSP assignments compared against CATH, and against SCOP. We need lower,upper controls to compare with lower control: intelligent guesswork 1. randomly assign CATH topology codes according to frequency 2. calculate true positive, false positive percentage
each domain was assigned a class according to 2nd structure: percentage of residues constituting a-helices / b-strands domain “1cgt03” 80% of AA in b-strand 10% of AA in a-helix Optimisation of similarity scoring methods: “Class pre-filter”
methods that use 2nd structure alignments are in better agreement with CATH • methods that use 2nd structure usually don’t benefit notably from class pre-filter. • partial agreement between classification schemes: FSSP compared with SCOP: 61.1%,FSSP compared with CATH: 46.7% • most accurate is method number 5: “Alignment of secondary structure elements without additional scoring”, with: 27.18% true positive. • accuracy ordering of methods doesn’t correspond to their relative complexity
Second evaluation: CASP-like sensitivity similarly to CASP – we measure the sensitivity of each method: what is the probability of a method correctly assigning a fold? lower control: a random proportional fold assignment upper control: FSSP was used as a scoring method
Sensitivity results: • method 5 wins again: 31.8% sensitivity. other 2nd structure based methods with small gap. • sensitivity order of the methods ~ true positive percentage order.
(a) (b) 1ckjA2 1bec01 1irk02 1dar02 1phk02 1tcrA2 1ampE2 1hcl02 1sgpE2 1ckjA2 1kobA2 1gdj00 1edhA2 1hbg00 1nfkA1 1babA0 1lhs00 1sgpE1 1mba00 1itbB1 1eca00 1ithA0 1sgt02 1ash00 1try02 1flp00 1jxpA2 1sctA0 1cpcA0 1svpA2 1ddt02 1cgt03 1colA0 Similarity trees - can we construct classification? Best method’s similarity scores for all pairs were clustered into a tree. • globin-like <> • casein kinase b. immunoglobulin-like <> thrombin subunit H wholetree: generally disordered
Conclusions • Baseline level to be exceeded by fold recognition methods: • 27% true positive assignments allowing 3% false positive; • sensitivity level of 32%. • methods which make use of 2nd structure information • seem more accurate and sensitive than those who don’t. • simple 2nd structure alignments alone can not construct • reliable classification hierarchy. • the agreement between FSSP, SCOP and CATH • classification schemes is surprisingly low.