Download

1 / 15
150 likes | 173 Views
This workshop summary highlights the predictive analysis using the probit approach to identify peaks and troughs in real house prices. Discussions include recent trends, rebounds, slides, and modeling major fluctuations in the housing market. The session delves into theoretical and empirical models, estimation results from historical data, and in-sample versus out-of-sample predictions for peaks and troughs scenarios based on different economic conditions. Forecasts for downturns, rebounds, and long-term declines are outlined for various countries.

E N D
Predicting peaks and troughs in real house prices: a probit approach LIME Workshop Brussels, 8 December 2011 Paul van den Noord
Sharp rebounds • Real house prices, index 2009Q1 = 100 Recent developments
Weak or faltering rebounds • Real house prices, index 2009Q1 = 100 Recent developments
Continued slides • Real house prices, index 2009Q1 = 100 Recent developments
Working off earlier busts • Real house prices, index 2009Q1 = 100 Recent developments
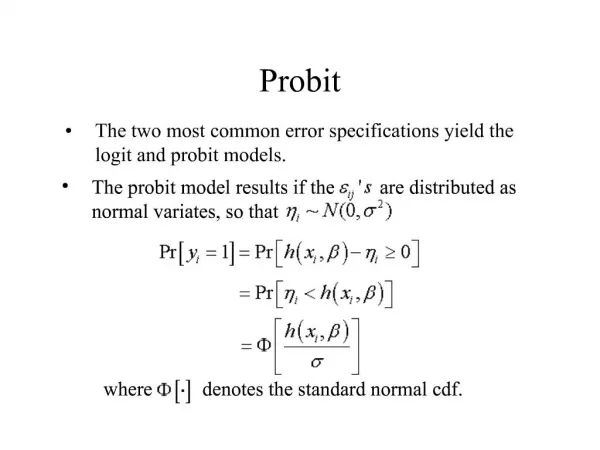
Some unpleasant maths The theoretical model
Some unpleasant maths The theoretical model
Major peaks and troughs Peaks and troughs at least 6 quarters apart “Major” if >15% up T-P and >7½ % down P-T The empirical model Financial Crisis S&L, EMS, Japan OPEC I and II Great Moderation
Estimation results 1970-2005 The empirical model 1. ***, **, * denote significance at the 1, 5, and 10% significance levels, res pectively. P-values (in parentheses) are based on robust standard errors. Explanatory variables are averaged over two quarters (the quarter prior to a peak/trough and the same quarter when a peak/trough occurs), if not stated differently. 2. Refer to changes in percentage points, not in probabilities, and evaluated at the means of the explanatory variables. Semi-elasticity rather than a marginal effect is reported for the log of the long-term interest rate. 3. Averaged over four quarters.
In-sample predictions The empirical model
Out-of-sample predictions: peaks The empirical model
Out-of-sample predictions: troughs The empirical model
Likelihood of troughs Predictions 1. Scenario 1 assumes constant real house prices over the projection period. 2. Scenario 2 assumes constant real house prices over the projection period and 2 percentage points higher interest rates than in the baseline by 2012Q4 (with the difference building up in a linear fashion from 2011Q3 onwards). 3. Scenario 3 assumes increasing real house prices by 10% over the projection period. 4. Scenario 2 assumes increasing real house prices over the projection period and 2 percentage points higher interest rates than in the baseline by 2012Q4 (with the difference building up in a linear fashion from 2011Q3 onwards).
Likelihood of peaks Predictions Note: + indicates a peak based on the cut-off level corresponding to the unconditional probability of a peak. 1. Scenario 1 assumes constant real house prices over the projection period. 2. Scenario 2 assumes constant real house prices over the projection period and 2 percentage points higher interest rates than in the baseline by 2012Q4 (with the difference building up in a linear fashion from 2011Q3 onwards). 3. Scenario 3 assumes increasing real house prices by 10% over the projection period. 4. Scenario 2 assumes increasing real house prices over the projection period and 2 percentage points higher interest rates than in the baseline by 2012Q4 (with the difference building up in a linear fashion from 2011Q3 onwards).
Forecasts Downturns ending? United States*, United Kingdom†, Italy†, Denmark†, Greece**, Ireland**, Korea†, Netherlands†, New Zealand†, Spain** Rebounds ending? France*, Canada*, Australia*, Belgium*, Finland*, Norway*, Sweden** ,Switzerland † Long-term declines ending ? Japan* , Germany** ___________ † No * Yes after a further fall (rise) in real prices ** Also at current real prices The results Source: Authors’ calculations.