Download

1 / 24
240 likes | 384 Views
Understanding p-values. Annie Herbert Medical Statistician Research and Development Support Unit annie.herbert@manchester.ac.uk 0161 2064567. Outline. Population & Sample What is a p-value? P-values vs. Confidence Intervals One-sided and two-sided tests Multiplicity

E N D
Understandingp-values Annie Herbert Medical Statistician Research and Development Support Unit annie.herbert@manchester.ac.uk 0161 2064567
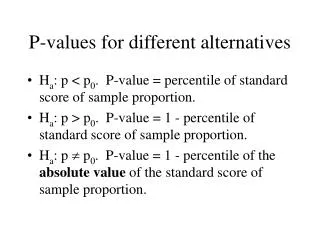
Outline • Population & Sample • What is a p-value? • P-values vs. Confidence Intervals • One-sided and two-sided tests • Multiplicity • Common types of test • Computer outputs
‘Population’ and ‘Sample’ • Studying population of interest • Usually would like to know typical value and spread of outcome measure in population • Data from entire population usually impossible or inefficient/expensive so take a sample (even census data can have missing values) • Want sample to be ‘representative’ of population • Randomise
Randomised Controlled Trial (RCT) OUTCOME GROUP 1 POPULATION SAMPLE RANDOMISATION GROUP 2 OUTCOME
5 Key Questions • What is the target population? • What is the sample, and is it representative of the target population? • What is the main research question? • What is the main outcome? • What is the main explanatory factor?
Example – Dolphin Study • Population: people suffering mild to moderate depression • Sample: outpatients diagnosed with suffering from mild to moderate depression - recruited through internet, radio, newspapers and hospitals • Question: does animal-facilitated therapy help treatment of depression? • Outcome: Hamilton depression score at baseline and end of treatment • Explanatory Factors: whether patients participated in dolphin programme (treatment) or outdoor nature programme (control)
Dolphin Study - Making Comparisons BMJ - Antonioli & Reveley, 2005;331:1231 (26 November)
Dolphin Study - does the treatment make a difference? • For both groups the Hamilton depression score decreased between baseline and 2 weeks • Clearly for our sample the treatment group has a better mean reduction by: 7.3 - 3.6 = 3.7 points • What does this tell us about the target population?
What is a p-value? • Assume that there is really no difference in the target population (this is the null hypothesis) • p-value: how likely is it that we would see at least as much difference as we did in our sample? • Dolphin study example: if treatments are equally effective, how likely is it that we would see a difference in mean reduction between the treatment and control groups of at least 3.7 points? P=0.007
Assessing the p-value • Large p-value: • Quite likely to see these results by chance • Cannot be sure of a difference in the target population • Small p-value: • Unlikely to see these results by chance • There may be a difference in the target population
What is a small/large p-value? • Cut-off point (‘significance level’) is arbitrary • Significance level set to 5% (0.05) by convention • Regard the p-value as the ‘weight of evidence’ • P < 5%: strong evidence of a difference • P ≥ 5%: no evidence of a difference (does not mean evidence of no difference)
Types of Statistical Error • Type I Error = Probability of rejecting the null hypothesis when it is in fact true. • Type II Error= Probability of not rejecting the null hypothesis when it is false.
Confidence Intervals • Confidence interval = “range of values that we can be confident will contain the true value of the population” • The “give or take a bit” for best estimate • Dolphin study example: what is the range of values that we can be confident contains the true difference of mean reduction between treatment and control group? (95% CI: 1.1 to 6.2)
p-values vs. Confidence Intervals • p-value: • Weight of evidence to reject null hypothesis • No clinical interpretation • Confidence Interval: • Can be used to reject null hypothesis • Clinical interpretation • Effect size • Direction of effect • Precision of population estimate
Statistical Significance vs.Clinical Importance • p-value < 0.05, CI doesn’t contain 0: indicates a statistically significant difference. • What is the size of this difference, and is it enough to change current practice? • E.g. Dolphin study: - P=0.007 - 95% CI = (1.1, 6.2) • Expense? Side-effects? Ease of use? • Consider clinically important difference when making sample size calculations/interpreting results
One-sided & Two-sided Tests • One-sided test: only possible that difference in one particular direction. • Two-sided test: interested in difference between groups, whether worse or better. Dolphin study example: is the treatment reduction mean less or greater than the control reduction mean? • In real life, almost always two-sided.
Multiplicity E.g. Significance level = 0.05 1/20 tests will be ‘significant’, even when no difference in target population
Reducing Multiplicity Problems • Pick one outcome to be primary • Specify tests in advance • Focus on research question and keep number of tests to a minimum • Do not necessarily believe a single significant result (repeat experiment, use meta-analysis)
Types of Outcome Data • Numerical/Continuous • Example: Weight • Graphs: Histogram/Boxplot • Summary: • Mean (SD) • Median (IQR) • Test (two groups): • t-test or Mann-Whitney U Categorical Example: Yes/No Graphs: Bar/Pie Chart Summary: Frequency/Proportion Test: Chi-squared
Notable Exceptions • Comparing more than two groups • Continuous explanatory factors • Paired Data: • Paired t-test • Wilcoxon • McNemar • Time-to-event Data: Log-rank test (For all of the above, seek statistical advice)
Final Pointers • Plan analyses in advance • Seek statistical advice • Start with graphs and summary statistics • Keep number of tests to a minimum • Include confidence intervals • ‘Absence of evidence is not evidence of absence’